
No reflection on the future without knowledge of the past, if possible supported by coherent quantitative developments in time and space. The construction of the latter cannot be improvised. It presupposes common and precise definitions as well as a solid measuring device.
The 889 million inhabitants (Mh) populating the planet in 1800 took from their natural environment a little over 300 million tons of oil equivalent (Mtoe), or 0.34 toe per capita. Two centuries later, this withdrawal by a world population that has crossed the threshold of 6 billion (Gh) has risen to 9.2 billion toe (Gtoe), or 1.5 toe per capita. This 4.5-fold increase in average annual per capita consumption is inextricably linked to the expansion of economic activities and the well-being of part of the world’s population, but it is also the cause of environmental degradation and a serious threat of climate change[1] (Read: The energy transition, a major challenge for the planet). Can past trajectories be reversed, and if so how, in the coming decades?
It is difficult to answer this question without an understanding of two centuries of unprecedented energy growth in human history. This understanding is obviously based on the work of historians who have focused on the technical, economic and social changes that led to new energy needs and new sources of energy before the first industrial revolution (Read: World energy consumption before the industrial era), and then throughout the 19th century. However, in order for the results of this work to be included in periodized and spatialized trajectories, these trajectories must be reconstructed. To achieve this (see World energy consumption 1880-2000: results), the question of sources of information on the evolution of energy consumption is inescapable (see World energy consumption 1880-2000: sources of information), but it presupposes a precise definition of this consumption and an explanation of its measurement.
1. From primary sources to energy services
Between the extraction or exploitation of a natural resource and the satisfaction of a need by an energy service, several conversions take place which are described in energy balances (see: The energy balance).
At the primary stage, the energy consumption corresponds to the sum of the energy sources in their raw state (raw energy), before any physical transformation and possible conversion into electricity in a so-called conventional thermal power plant. In addition to fossil fuels (mineral coal, crude oil, natural gas) and biomass, it would be consistent to include uranium from nuclear power plants, geothermal heat, and the power of rivers or wind converted into electricity. The limitations of collecting the statistics necessary for energy accounting have led us to consider these energy sources in terms of the kWh they supply, measured at the terminals of power plants. This is referred to as primary electricity.
Secondary energy consumption covers primary sources after the physico-chemical transformation of crude oil into petroleum products, of biomass into fuels or synthetic gas, of mineral coal or fuel oil.
into secondary electricity. If we include transport and distribution, which, with further losses, adapt the energy flows to the locations and modulations of the uses, we obtain a final consumption, measured at the doors of the industrialist or private individual who uses the energy (Figure 1).
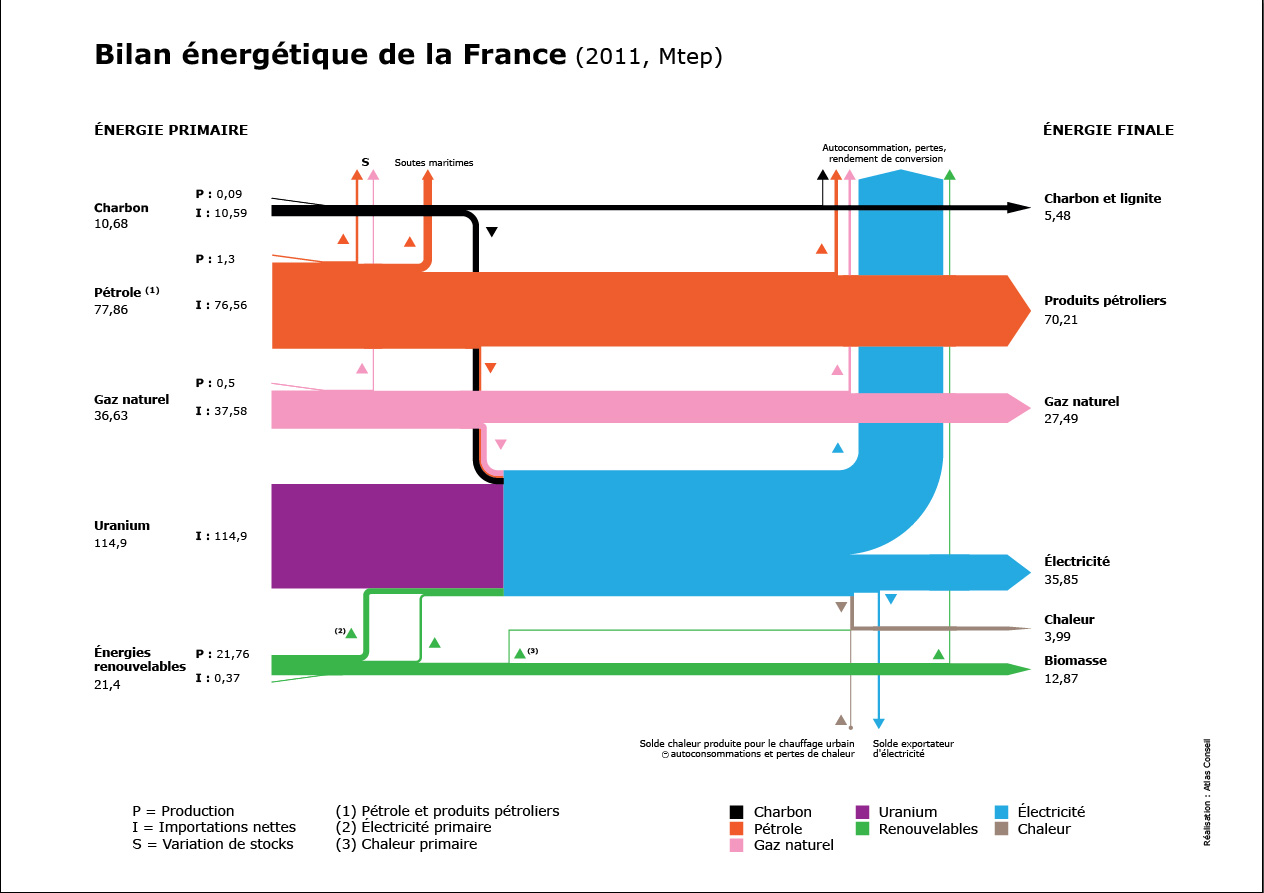
Fig. 1: From primary to final. [Source: lewagges.fr]
Beyond that, after a final transformation into thermal, mechanical or light energy, in a boiler, a motor or an electric bulb, the final consumption becomes useful energy.
Understood at the primary, secondary, final or useful level, energy consumption covers different realities both in quantitative terms (each conversion leads to losses) and qualitative terms (the energy sources change their properties after each conversion). Ideally, it would be possible to track the flow of energy used by a national economy from the production or import of primary sources to their transformation into energy services. Where statistical data permit, such tracking is rich in information about the economic and technological changes that cause a change in consumption of primary sources.
Country by country and over certain years, we will therefore always try to go down to the level of final consumption broken down into major sectors of activity (industry and agriculture, residential and tertiary, transport) and the main uses of energy (high- and low-temperature heating, stationary and mobile mechanical, and specific including lighting and electrochemicals-metallurgy). Unfortunately, the long series reconstructed at the world level over the period 1800-2000 only cover primary energy sources, because statistical records, when they exist, only go beyond this stage for certain countries over recent periods.
2. The different sources of primary energy
Several distinctions must be made if we are to define precisely the primary energy sources that enter into the consumption whose evolution must be traced.
2.1. Endo and exosomatic sources
Energy consumption in the broadest sense covers the so-called exosomatic sources as opposed to the endosomatic sources. The latter correspond to the quantities of energy incorporated in the food necessary to maintain the human organism at a certain temperature, and therefore to the life of man, and to the actual or potential exercise of his muscular strength (Read: Conversion of the chemical energy of plants into muscular energy). Explained in relation to the evolution of energy consumption before 1800, these energy sources are no longer taken into account in the evolution of world consumption in the following centuries (Figure 2).
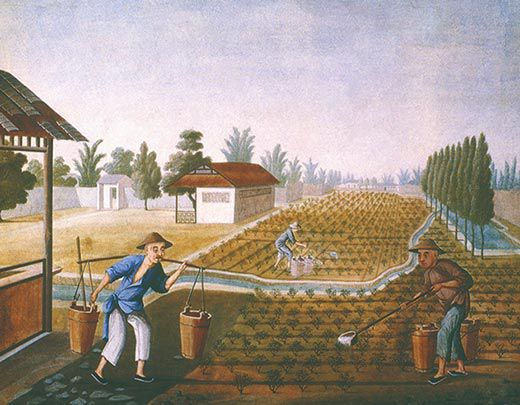
Fig. 2: Endosomatic energy. [Source: Smithsonian Magazine]
2.2. Various exosomatic sources
In order to reconstruct the evolution of consumption over the last two centuries, exosomatic sources must in turn be separated into so-called commercial and non-commercial sources, because access to information is completely different in each case.
Because they take the form of products extracted, transformed, transported and distributed by industrial enterprises with accounting departments that produce annual results that are taken up by the statistical services of the States, consumption of commercial sources (mineral coal, oil and oil derivatives, gas, electricity) has been the subject of statistical surveys for varying periods of time depending on the country. For this reason, they are the only ones taken into account by many authors, even though they represented less than 5% of the world’s exosomatic consumption at the beginning of the 19th century and are still not in the majority in many developing countries[2].
We cannot therefore exclude the so-called non-commercial sources of energy. What are they? Some of them deliver fixed mechanical energy (water extraction) or mobile energy (transport of goods), from the muscular force of pack animals and draught animals (pack and work) or from the force of water and wind via traditional converters such as dugout canoes, sailing ships, windmills or watermills. Others that mainly provide thermal energy are grouped under the neologism of biomass, which designates ” the mass of living matter, plant or animal, that a given area produces. It takes into account a single origin, photosynthesis (Read: Photosynthesis and biomass), and the resulting unit of composition: the hydrocarbons of which living beings are composed” [3]. From the point of view of energy consumption, this biomass takes several forms (See: Biomass and energy):
- fuel wood
in all its aspects (twigs, coppice, dead or felled trees),
-
- vegetal waste from forestry activities such as bark, sawdust and timber industry wastes, or from agricultural activities such as sugarcane bagasse, crop stalk and cereal straw, rice and coffee husks, vine stems and shoots, palm oil;
-
- animal waste;
- municipal solid wastes and industrial wastes.
Firewood and waste of all types constitute biomass energy. All of these resources are considered primary, although some, such as waste, are already the result of human activities. Most of them are used as they are (mainly combustion), but some are transformed into secondary sources either by traditional devices (charcoal, alcohol) or by modern devices of combustion, gasification or pyrolysis.
Even though very difficult to account for, all these energy sources must be taken into account in the energy consumption, as Palmer Putnam already pointed out in 1953: ” Some authors have omitted wood. Others have built up an energy time series in which the wood component is held at a constant value. In the time series of this report, the contribution of wood has been worked out either from government data or from estimates supplied by the United Nations. Many authors have omitted farm wastes. But Argentine wheat and Indian cattle dung cakes are major sources of energy in those countries; and in the world at large, farm wastes apparently contribute between 10 and 20 per cent of the total energy.
More than half a century later, the absolute and relative values have varied, but the gaps have not been filled (Figure 3).

Fig. 3 : Palmer Cosslet Putnam (1900-1984). [Source : Revolvy]
3. Units of measurement and equivalence
Each primary energy source is normally measured and accounted for in units of mass (pound, ton, short or long ton), volume (barrel, gallon, cord, m3) or electricity (kWh and its multiples). Within each family of units, conversions are possible (notably between metric and Anglo-Saxon units), but they do not allow the aggregation of all energy sources (Read: Energy units). To do this, we need a general system of equivalence that has been constructed on the basis of the calorific value of each source measured by the heat of combustion released at a conventional flame temperature of 2200° K (Kelvin): on this basis “a calorie is always worth a calorie, whatever its temperature “[5]. We can thus reduce all physical volumes to heat or to its work equivalent.
In the international system, the latter is preferred since the only unit used is the Joule (J), but in practice the calorie has the advantage, the two units being linked by rigorous equivalences:
- 1 Joule = 0.239 calories
- 1 calorie = 4.184 Joule[6].
The volumes involved in national energy consumptions are such that these small units are always replaced by their multiples:
- kilo (103), thousand, especially kcal, kJ
- mega (106), million, noted MM in the United States
- giga (109), billion in Europe, trillion in the United States
- tera (1012), trillion in Europe, trillion in the United States
- peta (1015), quatrillion in the United States
- exa (1018), quintillion in the United States.
Specifically, the calorific content of the various energy sources are given in Netcalorific value(NCV) which differs from Gross calorific value (GCV) by the latent heat of the water vapor produced during combustion and estimated at 3-5% for solid fuels, 6-8% for liquids and 10% for gases and biomass.
To make the volumes of energy consumed more meaningful, GJ and Gcal are usually replaced by tons of coal equivalent (tce) and for the last 40 years by tons of oil equivalent (toe) on the following conventional basis[7] :
- 1 tce = 29.3 GJ = 7.0 Gcal
- 1 toe = 42.0 GJ = 10.0 Gcal.
The equivalents used for the long-term reconstruction of world energy consumption are very close to those mentioned above, but they are more numerous when modulated country by country to take into account the variety and evolution of the qualities of the coals, oils and gases produced and imported by each country. The values used are those of the International Energy Agency (IEA), which are closer to reality than those of the United Nations. For the period before 1950, the equivalence coefficients for that year have been backcast.
What remains to be included in this equivalence system is electricity? Electricity from thermoelectric power plants (more than 65% of world production in 2000) does not raise any difficulties since it is represented by the calorific value of the fuels used to generate it. On the other hand, the kWh from hydro, nuclear, geothermal, wind or solar power can be transformed into kcal by multiplying each of them,
- either by 860 kcal, quantity of heat released by their passage in an electric resistance by Joule effect,
- or by 2600 kcal, quantity of heat necessary to its generation in a modern thermo-electric power station.
Each type of equivalence has advantages and disadvantages. The first, called equivalence to use, is independent of the efficiency of transformation of fuels into electricity, and therefore invariable in time and space. The second, called production equivalence, standardizes the thermal equivalence of all kWh by treating those of hydro or nuclear origin as if they were from the combustion of fossil or biomass sources. National and international administrations have been arguing over the choice of the least bad system for ages: France had opted for the second one, which valued its nuclear electricity production; the United Nations has always preferred the first one, which avoids taking into account international differences in the transformation efficiency of thermoelectric plants.
To get out of this dilemma, the International Energy Agency (IEA) recommends the adoption of equivalences expressing the differences in efficiency of primary electricity production techniques, i.e. 860 kcal for electricity from hydro and wind power obtained with efficiencies close to 100%; 2600 kcal for electricity from nuclear power (efficiency close to 30%) and 8600 kcal for electricity from geothermal power (efficiency of around 10%).
Unless otherwise stated, the equivalence used in all the statistical series of the book will always be 860 kcal: it minimizes the actual place that primary electricity has taken in the world energy supply, but it alone allows spatial and temporal comparisons, which is essential for our purpose.
4. Spatial organization of consumption statistics
Almost all studies of economic growth are based geographically on ” social units that we call nations or nation-states “[8]. This is also true for the study of the growth of energy consumption, because this is the basis on which the statistical data are provided and because energy data need to be matched with other data (population or GDP), which all have a national basis. This spatial organization of data is not always self-evident, however. It must also be complemented by regional groupings, the basis of which must be discussed.
4.1. National databases of digital data
Where they exist, numerical data are provided in the form of apparent land consumption for a given country in a given calendar year. Consumption is said to be apparent because it is calculated on the following basis:
C = P + I – E ± VS –bunkers, where P = domestic production
I = imports
E = exports
VS = inventory changes
The apparent qualifier specifies that, even when stock variations are well known (which is rare), the volumes measured do not necessarily correspond to those absorbed by the national economy during the year, since real flows and recorded flows do not coincide exactly.
It should also be noted that the exclusion of bunkers (sea and air), which is logical from the point of view of national consumption, introduces a bias from the point of view of world consumption.
The main difficulty with time series is the shifting of nation-state borders, and hence the breaks in series that this entails. As a general rule, the solutions recommended by Angus Maddison have been adopted in order to neutralize the effects of these shifts[10]. We therefore reason in constant territory by applying a correction coefficient to all the years prior to the change in boundaries. Its impact is only really significant for those European countries whose borders were redefined at the end of each world war or at the time of the collapse of communism: Austria, Germany, France (in the case of Alsace-Lorraine), Hungary, Poland, Romania, Russia/USSR. Elsewhere, the separation of the two Koreas and that of India-Pakistan are also delicate to deal with (Figure 4).

Fig. 4 : Angus Maddison (1926-2010 ). [Source : OECD.org]
Within this framework, the evolution of primary energy consumption in 44 countries could be traced. For the years prior to 1950, stock changes and bunkers have not been taken into account because they are not known and, in any case, are below the margins of uncertainty surrounding annual consumption.
4.2. Regional groupings
Reconstructing the evolution of world energy consumption over two centuries by summing up national consumption requires intermediate geographical groupings that make it possible to attenuate the effects of certain statistical gaps and that offer relatively homogeneous areas for analysis.
Such groupings already exist in the organization of energy consumption statistics. One of the most common is the OECD countries, the communist countries, and the developing countries: it is easy to see how irrelevant this is for the last decade of the 20th century and for the period before 1950. The World Energy Council (WEC), after having constructed its own regions (North 1, North 2, South 1, Third World in transition…)[11], has returned to a more traditional division (North America, Latin America, Western Europe…)[12]. This could have been adopted had it not been for two defects: by attaching North Africa to the Middle East, it cuts out the African continent, whose unity is justified over a very long period; by treating the Commonwealth of Independent States (CIS) as a region, it unnecessarily rigidifies the very evolving situation of the former Soviet Union.
The grouping finally chosen is as close as possible to the division of the world into continents: Africa, Latin America (South, Central and Caribbean), North America (United States and Canada), Asia (broken down when possible into the Far East and the Near East), Eastern Europe (Central Europe and the former USSR), Western Europe, Oceania (Australia, New Zealand and the Pacific Islands). The main problem encountered and not satisfactorily resolved concerns the place of East Germany (ex-GDR), which is split between Eastern and Western Europe.
In order to be able to use Angus Maddison’s long series (population and GDP) in this breakdown, the latter’s regions had to be modified as follows:
- southern Europe was attached to Western Europe, after excluding Turkey, which was attached to Asia;
- the New Countries have been split into two groups: United States and Canada forming the North American region; Australia and New Zealand forming Oceania;
- untouched Latin America includes South America, Mexico and Central America;
- eastern Europe remains the one defined by A. Maddison, i.e. it includes the former USSR but not the former GDR (East Germany), which is included in Western Europe;
- asia finally extends from Turkey to Japan without any exclusivity.
Notes and references
[1] Borrowed from economic vocabulary, the term energy consumption has become commonplace, although it is disputed by physicists for whom only the term conversion accounts for the use of an energy source.
[2] For Joël Darmstadter ” Animate energy (draft animal or human) is excluded from the statistical compilation. Nor has any attempt been made to develop statistics on vegetable fuels, such as cow dung or bagasse, or on fuelwood production and consumption, despite the importance of these energy forms in many of the underdeveloped countries as well as (in the case of wood) certain industrialized countries of Europe”. Darmstadter (Joel) with Teitelbaum Perry D and Polach Jaroslav G (1971). Energy in the world economy. A statistical review of trends in output, trade and consumption since 1925. Baltimore and London: The Johns Hopkins Press, 876 p, (p. 818). Similarly, Bouda Etemad points out that in his yearbook, in addition to non-commercial sources such as organic waste and animal energy, “wood is the only partially commercial primary energy source that we have had to eliminate for lack of sufficient statistical sources. Etemad Bouda and Luciani Jean, under the direction of Bairoch Paul and Toutain Jean-Claude (1991). World energy production. Geneva: Droz, 227 p, (p. XXI).
[3] Piermont Laurent (1982). L’énergie verte. Paris: Ed. du Seuil, 223 p, (p. 17).
[4] Putnam Palmer Cosslet (1953). Energy in the future. Princeton : D. Van Nostrand Co, 556 p, (p. 325).
[5] Rousseaux Patrick and Apostol Tiberiu (1999). Environmental value of energy. Lausanne: Presses Polytechniques et Universitaires Romandes, 186 p, (p. 2).
[6] We recall that the Joule is defined as the product of a force of 1 Newton (N) by a displacement of 1 meter. A work of 1 J per second is equivalent to a power of 1 Watt (W), i.e.103 W x 1 hour = 1 kWh = 3.6 x10⁶J. The calorie is defined as the quantity of heat necessary to raise 1 cm3 of water by one degree centigrade.
[7] In many Anglo-Saxon works, the heat content is not expressed in calorie but in British Thermal Unit (BTU), the latter being defined as the amount of heat required to raise 1pound of water by 1 degree Farenheit. There are 3.968 Btu per kcal, or, rounding up, 40×106 Btu per toe. A conversion table of all calorific contents to Btu can be found in Putnam (Palmer), op. cit. p. 326. The author frequently uses the symbol Q to denote 1018 Btu.
[8] Kuznets Simon (1972). Growth and economic structures. Paris: Calman-Lévy, 442 p, (p. 9).
[9] United Nations (1976). World energy supplies 1950-1974, New York, statistical paper, series J n° 19, 824 p.
[10] Maddison Angus (2001). The world economy: 1820-1992, analysis and statistics. Paris: OECD, 274 p, (p 247-49).
[11] World Energy Conference (1989). World Energy Horizons. Paris: Ed. Technip, 378 p, (p. 203).
[12] World Energy Council (1993). Energy for tomorrow’s world. Paris: Ed. Technip, 368 p, (p. 330).
The Encyclopedia of Energy is published by the Association of Encyclopedias of Environment and Energy (www.a3e.fr), contractually linked to the University of Grenoble Alpes and Grenoble INP, and sponsored by the Academy of Sciences. To cite this article, please mention the name of the author, the title of the article and its URL on the site of the Encyclopedia of Energy. The articles of the Encyclopedia of Energy are made available under the terms of the Creative Commons Attribution-NonCommercial-NoDerivs 4.0 International license.