
With an energy consumption of about 1 billion tons of oil equivalent (Gtoe) in 2021, India ranks third in the world. How has it reached this position since the liberalization that began in the 1990s? What are the challenges of its energy system in the face of the dilemma of satisfying very large needs, particularly from mineral coal, without increasing its environmental impacts, including climate?
_____________________
At the end of the Fifth Plan (1974-79), the Indian economy completed three decades of growth at an average annual rate of around 5%, which, after the downturn at the end of the 1960s and the impact of the oil shocks of the 1970s, was less and less able to meet the expectations of a population that was growing by an average of more than 2% a year. In 1980, Indira Gandhi’s return to power was not enough to revive the development project conceived in the early 1950s (see: Energy in India, from Jawarla Nehru to Indira Gandhi).
Above all, in comparison with the dynamism of the Chinese economy since the reforms of Deng Xiaoping in the early 1980s (see: Energy in China, the reforms of Deng Xiaoping), the Indian economy is increasingly subject to criticism of the “administrative straitjacket” accused of stifling all initiatives and innovations. There are several signs that it is “going to undergo a profound gradual change in its political configuration, economic strategy and performance”[1]. What were the economic and social changes that made up this turning point? What were their links with the transformations of the Indian energy system between 1990 and 2021?
1. From statism to liberalism
The idea of revitalizing the economy by liberalizing it has never been totally absent, especially in the minds of the leaders of large companies, but it only came to the fore late and in small steps, starting with the Second Plan (1956-61), within the framework of the Forum of Free Enterprise, created in 1957[2]. The debate widened in the second half of the 1970s under the impetus of reform advocates such as Ashok Desai, but it was not until the new payments crisis of 1980 that Indira Gandhi, who had returned to power, was forced to turn to the International Monetary Fund (IMF). The latter granted India special drawing rights (SDRs) in return for the beginning of economic liberalization:
– relaxation of regulations, including industrial licenses;
– easing of the import-export regime, especially for the benefit of exports;
– tax relief, especially on the income from assets of industrial companies.
In the context of a relaxation of external constraints, the results of the Sixth Plan (1980-85) show the first beneficial effects of liberalization, mainly in the form of productivity gains, the establishment of new enterprises, the consolidation of services and the modernization of agriculture.
Despite the vigorous growth of the Seventh Plan (1985-90), this progress was not enough to restore the balance of trade with the outside world, which was undermined by, among other things, an unchecked debt. After Rajiv Gandhi’s assassination on 21 May 1991, Narasimha Rao (Prime Minister) and Manmohan Singh (Finance Minister), with the support of the IMF, undertook structural reforms that included the abolition of licenses in most sectors, the authorization of foreign investment, the liberalization of foreign trade by lowering customs duties and the convertibility of the rupee.[3]
“With four successive years of growth above 7% (1994-97), the Indian economy rose from the ashes and even appeared for the first time as one of the most dynamic economies in the world. [4] Once again threatened by the political upheavals of the early 2000s, this dynamism was maintained by the new measures, such as the special economic zones (SEZs) offered to large industrialists, decided by the Manmohan Singh (Prime Minister) and Sonia Gandhi (leader of the Congress party) tandem from 2004. The economic growth rate reached 9% during the 10th Plan (2002-07) and the 11th Plan (2007-12).
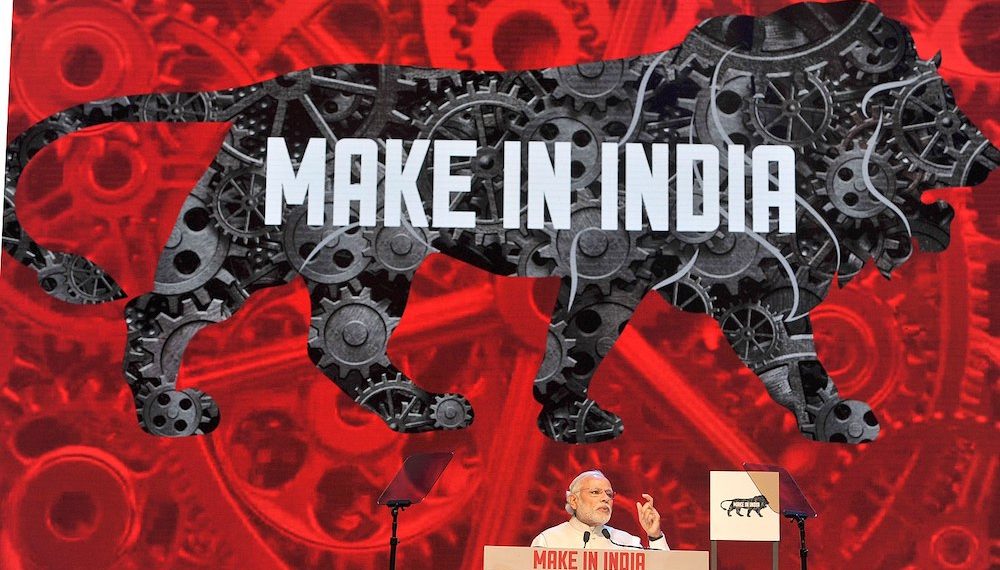
Weakened by the international consequences of the 2008 global crisis, the Indian economy then went through a difficult period (30% fall in the rupee in 2014) until the “tipping point in favour of Narendra Modi’s pro-active programme” elected in 2014 (figure 1). His “Make in India” program attracts many companies whose investments boost economic growth[5].

Figure 1: Narendra Modi. [Source: France Inter, https://www.franceinter.fr/emissions/geopolitique/geopolitique-03-mai-2021]
The Bhartiya Janata Party (BJP), which again won the May 2019 elections, wants to continue the momentum by consolidating the infrastructure of the Indian economy. From being the 7th largest economy in the world in 2017, India may have risen to 5th in 2018 and aspires to 3rd in 2030, an increasingly close competition with China[6]. How has it evolved its energy system to support such economic development?
2. Population and economic growth
Until the 2019 downturn and the 2020 Covid-19 crisis, with an average annual rate of economic growth five times that of population growth, India has become considerably richer, driven by the dynamism of both its manufacturing and services industries[7].
2.1. Demographic vitality
In 1990, after four decades of growth at an average annual rate of 2.2%, India’s population was approaching 900 million; thereafter, at an average annual rate of 1.5%, it continued to grow until it reached 1.37 billion inhabitants (Gh) in 2020 (Table 1), a few steps behind China (1.44). This is due to a birth rate that continues to fall from more than 30 per 1,000 to less than 20, while the death rate is now below 10. The economic changes expected in the coming decades are not expected to stop population growth to 1.5 Gh in 2030 and perhaps 1.7 Gh in 2050.
| Population
Mh |
Urbanization
% |
GDP G$ ppp | Primary | Secondary % of GDP | Tertiary % (%) | |
| 1990 | 870 | 25.6 | 987 | 32 | 27 | 41 |
| 1995 | 964 | 26.6 | 1 426 | 27 | 27 | 46 |
| 2000 | 1 057 | 27.7 | 2 078 | 22 | 28 | 50 |
| 2005 | 1 148 | 29.2 | 3 238 | 20 | 27 | 53 |
| 2010 | 1 234 | 30.9 | 5 312 | 17 | 28 | 55 |
| 2015 | 1 310 | 32.8 | 7 160 | 15 | 29 | 56 |
| 2018 | 1 353 | 34.0 | 9 000 | 15 | 28 | 57 |
| 2020 | 1 367 | 35.0 | 8 680 | 14 | 27 | 59 |
Table 1. Population and economic growth. Source. World Perspective. University of Sherbrooke, Quebec, Canada and Knoema’s World Data Atlas for GDP and its structure. The series in G$ ppp is only 10% close to the series in constant $ used from 1950 to 1980, in table 2, Energy in India, from Jawarlal Nehru to Indira Gandhi. The structure of GDP in 1990 differs very significantly from one statistical source to another, with no possibility of choice given the differences in the method of evaluation.
The majority of the population continues to live in the countryside, in about 600,000 villages (figure 2), but urbanization is accelerating. The 18% urbanized in 1950, which had fallen to just over 25% in 1990, will reach 35% in 2020, divided between :
– 40% in small towns of less than 100,000 inhabitants,
– 30% in cities with populations between 100,000 and 1 million,
– 30% in about fifty metropolises, the largest of which (Mumbai, Delhi, Kolkata, Chennai or Bengaluru) have a population of 8 to 18 Mh[8].
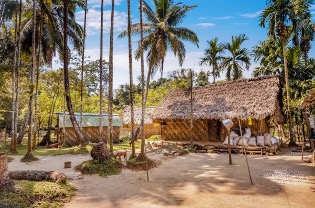
Figure 2. Indian village. [Source: Depositphoto]
Despite this strong growth, India’s urbanization rate remains relatively low compared to that of other major developing countries such as Egypt (43%), Nigeria (49%), Indonesia (55%), China (57%), Mexico (80%) or Brazil (86%), hence the expectation that the movement will continue towards 70% by 2050. By then, the expansion of slums should have been halted in favor of the development of smart cities, of which a hundred or so are under construction. Through the need for transport, roads and lighting, these developments obviously have an impact on energy needs and the infrastructure, particularly gas and electricity networks, that enable them to be met.
2.2. A dynamic economy
On average, this population has grown richer thanks to an average annual growth in Gross Domestic Product (GDP) jumping from 4.2% between 1960 and 1990 to 5.8% between 1990 and 2020[9]. This increase is not unrelated to the structural evolution of economic activity: the division by more than two of the share of the primary sector (agriculture, forestry, mining) being compensated by the sustained increase of the tertiary sector (transport, services) while the secondary sector (manufacturing and construction) remained stable.
Among the internal changes in each major sector of activity, some have had a greater impact than others on the evolution of energy consumption and production.
Agriculture, despite its structural weaknesses (very small size of a large number of farms, peasant under-nutrition in some states, erosion and dependence on the monsoon, among others), has made considerable progress in recent decades, making India the world’s leading producer of milk, jute, cotton and bananas, and the second largest producer of wheat, rice (behind China) and sugarcane (behind Brazil). Supporting these growths, the peasant demography but especially the intensification of production methods, inherited from the green revolution, following the crisis of the mid 1960s. Based on the development of irrigation and mechanization, the selection of high-yielding varieties and the increased use of chemical fertilizers, productivity has increased, leading to a growth in energy needs, particularly in the form of electricity[10].
In industry, the development of energy-intensive industries such as iron and steel and chemicals has influenced the energy system more than others. The production of the former has jumped from 38 Mt of steel in 2005/06 to 110 Mt in 2019, which is not excessive given the power of private Indian steel companies (Tata Steel and Mittal Steel) that have been able to absorb the largest European companies (the Anglo-Dutch Corus and the French Arcelor)[11]. Among the main clients of these industries is the automobile industry, most often in joint ventures with large foreign, Japanese and European groups.
For its part, the chemical industry has relied on a powerful petrochemical industry and an increased use of natural gas. The 32.3 Gm3 of the latter fuel that it consumed in 2019, for both energy and raw material purposes, is well ahead of consumption by the power industry (17.3), transport (4.1) and households (3.9).
Among the services, transport was by far the main driver of growth in energy consumption. Unlike many industrializing countries, India has not given up on expanding and modernizing its rail network, one of the longest in the world. The 108,858 km in 1990/91 have become 126,366 in 2019/20, an average annual growth rate of 0.5%, which has allowed it to absorb 42% of freight and 20% of passenger traffic. The predominantly steam-diesel traction has gradually given way to electrification. By 2020, more than 70% of the 8 billion passengers (Gp) and 1,208 billion tons of freight (Gt) will have been moved on electrified tracks (Figure 3).
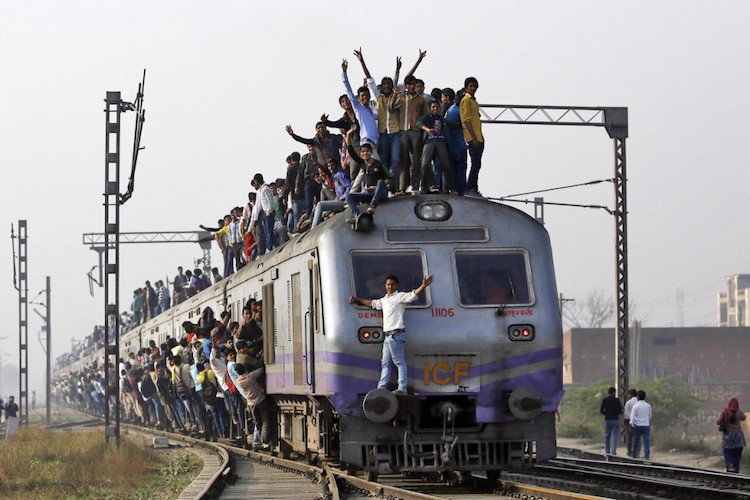
Fig. 3: Trains taken by storm. [Source: La Presse.ca, https://www.lapresse.ca/international/asie-oceanie/201502/26/01-4847713-inde-plus-de-170-milliards-pour-moderniser-le-reseau-ferroviaire.php]
On India’s 3.3 million km road network, the third largest in the world, the 54 million vehicles on the road at the beginning of the 21st century have grown even more, notably due to the National Highway Development Project (NHDP) linking Delhi, Mumbai and Kolkata[12]. Air transport, which is less voluminous, has grown much faster than its competitors, at an average annual rate of 16% during the 2010s, hence the plan to increase the number of operational airports from 103 to 190-200 between 2020 and 2040. Inland waterway and maritime transport also rely increasingly on petroleum products.
Not all energy industries have been equally able to meet these growing needs. The oil, gas and electricity industries have been constrained and have had to give coal a larger role than successive policymakers had hoped for.
3. Growth in energy consumption and transformation of the energy system
Between 1990 and 2020, total primary energy consumption grew at an average annual rate almost identical to that of the previous 40 years, at about 3% (Table 2). Non-commercial sources, whose share has continued to decline from 46 to 20 percent, have not disappeared because India has remained a predominantly rural country where petroleum products and electricity benefit small industry and the wealthy more than the poor peasants who continue to burn animal or vegetable waste and firewood[13].
| Years | Non-commercial consumption (Mtoe) | Share of this consumption (%) | Commercial consumption (Mtoe) | Share of this consumption (%) | Total consumption (Mtoe) | Tcam commercial sources (%) | Tcam total(%) |
| 1990 | 169 | 46 | 198.9 | 54 | 367.9 | ||
| 1995 | 182 | 41 | 258.8 | 59 | 440.8 | 5.4 | 3.7 |
| 2000 | 195 | 38 | 313.1 | 62 | 508.1 | 3.9 | 2.9 |
| 2005 | 189 | 33 | 389.8 | 67 | 578.8 | 4.5 | 2.7 |
| 2010 | 182 | 26 | 527.8 | 74 | 709.8 | 6.3 | 4.2 |
| 2015 | 164 | 20 | 672.9 | 80 | 836.9 | 5.0 | 3.4 |
| 2018 | 151 | 16 | 779.1 | 84 | 930.1 | 5.0 | 3.6 |
| 2020 | 182 | 20 | 744.0 | 80 | 926.0 | -6.0 | -1.0 |
Table 2. Evolution of total energy consumption. Source: BP Statistical Review and our estimates. The 1950 data differ slightly from those in Table 2, in Energy in India: the genesis of its powerful coal industry, notably for reasons of conversion of electricity consumption into toe. The results for 2020, which have fallen sharply due to the coronavirus, are still very provisional at the end of 2021.
The share of consumption of commercial sources (mineral coal, oil, natural gas, hydro, nuclear and intermittent renewables) jumped from 54 to 80% in connection with growth at an average annual rate of 4.4%, which could have been much higher if the use of these energy sources had not benefited from a sharp reduction in the energy intensity of economic activity, i.e., in kilo oil equivalent of commercial energy sources per dollar in constant GDP value (E/GDP): 0.20 (1990); 0.15 (2000); 0.09 (2010) and 0.08 (2020). The origin of this decline is less due to changes in supply than to changes in use and, above all, to advances in technology.
How much of the growth in consumption of commercial energy sources has been accounted for by the various sectors? While in most countries the decline of mineral coal has gone hand in hand with the growth of hydrocarbons and primary electricity, the Indian structure has remained relatively stable (Table 3).
| Years | Total (Mtoe) | Coal | Oil | Natural gas | Primary electricity | Coal (%) | Oil (%) | Natural gas (%) | Primary electricity (%) |
| 1990 | 198.9 | 109.7 | 57.9 | 14.8 | 16.5 | 55 | 29 | 7 | 9 |
| 1995 | 258.8 | 140.3 | 75.0 | 24.6 | 18.9 | 54 | 29 | 10 | 7 |
| 2000 | 313.1 | 164.4 | 106.2 | 21.8 | 21.0 | 52 | 34 | 7 | 7 |
| 2005 | 389.8 | 211.2 | 123.1 | 29.5 | 26.0 | 53 | 32 | 8 | 7 |
| 2010 | 527.8 | 290.4 | 156.7 | 50.7 | 30.0 | 55 | 30 | 9 | 6 |
| 2015 | 672.9 | 395.3 | 197.6 | 41.1 | 38.9 | 59 | 29 | 6 | 6 |
| 2018 | 779.1 | 452.2 | 236.6 | 49.9 | 40.4 | 58 | 30 | 6 | 6 |
| 2019 | 793.7 | 453.0 | 243.7 | 51.0 | 46.0 | 57 | 31 | 6 | 6 |
| 2020 | 744.4 | 425.0 | 220.0 | 51.4 | 48.0 | 57 | 30 | 7 | 6 |
Table 3. Changes in consumption of primary commercial sources. Source: BP Statistical Review. Nuclear, in “primary electricity”, is accounted for on the basis of 1 toe=4.4 TWh. The 2020 data, affected by Covid-19, are still very provisional.
However, this stability does not mean stagnation. India’s energy balance in 2021 is quite different from that of 1990, particularly in terms of the electricity generation mix (Table 4), but the country has had more difficulty than many others in substituting oil and natural gas for the mineral coal that has remained the last resort even in the age of greenhouse gas (GHG) emissions control.
| TWh | Therm. coal | Therm. oil | Therm. gas | Hydraulic | Nuclear | Wind power | Solar | Biomass | Total |
| 1990 | 191.6 | 13.3 | 10.0 | 66.4 | 6.4 | 0.1 | – | 0.1 | 287.8 |
| 1995 | 296.3 | 16.8 | 29.4 | 75.8 | 7.6 | 0.5 | – | 0.6 | 427.1 |
| 2000 | 390.2 | 29.2 | 56.0 | 77.0 | 15.8 | 1.6 | – | 1.7 | 571.4 |
| 2005 | 478.5 | 25.4 | 75.5 | 97.4 | 17.8 | 6.0 | – | 4.0 | 704.6 |
| 2010 | 643.0 | 10.8 | 118.0 | 108.7 | 23.1 | 19.5 | 0.1 | 14.3 | 937.5 |
| 2015 | 1006.6 | 9.1 | 64.8 | 133.3 | 38.3 | 32.7 | 6.6 | 25.8 | 1317.3 |
| 2018 | 1176.6 | 10.1 | 74.3 | 139.7 | 39.1 | 60.3 | 30.7 | 30.5 | 1561.3 |
| 2019 | 1184.5 | 5.1 | 67.5 | 162.0 | 45.2 | 63.3 | 50.1 | 26.0 | 1603.7 |
| 2020 | 1125.2 | 4.9 | 70.8 | 163.6 | 44.6 | 65.2 | 60.4 | 26.2 | 1560.9 |
Table 4. Evolution of electricity generation. Source: BP Statistical Review. 2020 data, affected by Covid-19, are still very provisional.
Where does this Indian peculiarity come from? Is geology the only reason? What role has the evolution of energy policy played, particularly under the influence of liberalization?
4. An oil industry faced with limited resources
The fact that the share of oil in India’s energy balance sheet has remained very stable from 1990 to 2020 (30%) does not mean that oil companies are not dynamic, but it does reflect the difficulties of overcoming certain obstacles, both on the demand and supply sides.
4.1. Fuel needs drive demand
Since 1990, consumption of petroleum products has quadrupled in India (Table 5), at an average annual rate of 5%, which is significantly lower than the 7% rate of the previous four decades (see Energy in India, from Jawarlal Nehru to Indira Gandhi). in line with past trends, the two big losers have been kerosene, which is declining in the countryside as it becomes more electrified, and heavy fuel oil, which is less popular with the railroads, the navy and heavy industry.
Even more than before 1990, it is therefore fuels that are driving the consumption of oil products. From 45%, their share gained two more points in 2018, but now the growth of gasoline consumption (7.4%) outweighs that of diesel (4.6%). This is due to the explosion in land, river, sea and air transport.
| Mt | 1990-91 | 2000-01 | 2010-11 | 2015-16 | 2017-18 |
| Light products | 9.42 | 25.30 | 39.20 | 54.74 | 62.40 |
| – Gasoline | 3.55 | 6.61 | 14.19 | 21.85 | 26.17 |
| – Naphtha | 3.45 | 11.67 | 10.68 | 13.27 | 12.89 |
| – Others | 2.42 | 7.02 | 14.33 | 19.62 | 23.34 |
| Average products | 32.75 | 52.93 | 74.54 | 88.15 | 93.07 |
| – Kerosene | 8.42 | 11.32 | 8.93 | 6.83 | 3.85 |
| – Diesel | 22.65 | 39.36 | 60.53 | 75.06 | 81.59 |
| – Others | 1.68 | 2.25 | 5.08 | 6.26 | 7.63 |
| Heavy products | 11.75 | 16.99 | 27.31 | 41.79 | 50.69 |
| – Fuel-oils | 8.99 | 12.65 | 10.79 | 6.63 | 6.72 |
| – Lubricants | 0.89 | 1.12 | 2.43 | 3.57 | 3.88 |
| – Bitumen | 1.58 | 2.77 | 4.54 | 5.94 | 6.09 |
| – Others (including petcoke) | 0.29 | 0.45 | 9.55 | 25.65 | 34.00 |
| Total | 53.92 | 96.22 | 141.05 | 184.68 | 206.16 |
| – Refinery and losses | 3.83 | 10.75 | 16.37 | 18.77 | 21.15 |
| Total | 57.75 | 106.97 | 157.42 | 203.45 | 227.33 |
Table 5. Consumption of petroleum products 1990-91-2017-18. Source: Ministry of Statistics. Energy Statistics 2013 and 2019. Other light products include LPG. Other heavy includes petcoke.
4.2. Refining expansion…
In response to this growth in demand, the Indian oil industry has continued to expand refining, which has jumped from 1.1 million barrels per day (Mb/d), or 55 Mt, in 1990 to 5 Mb/d, or 250 Mt, in 2020.
At the beginning of the 1990s, this refining park belonged to :
– three companies integrating refining, transportation and distribution: Indian Oil Corporation Ltd (IOCL), Hindustan Petroleum Corporation Ltd (HPCL) and Bharat Petroleum Corporation ltd (BPCL);
– four companies dedicated solely to refining: Cochin Refineries Ltd (CRL), Madras Refineries Ltd (MRL), Bongaigaon Refineries and Petrochemicals Ltd (BRPL), Mangalore Refineries and Petrochemicals Ltd (MRPL), all of which are at least 51% owned by the federal government[14].
Thirty years later, the three integrated companies are still very present, especially IOCL, which, with a dozen refineries, holds more than 30% of capacity. After liberalization in 1991, they were joined by two joint ventures and three private companies, including Reliance Industries Ltd. The latter built the huge refinery-petrochemical complex at Jamnagar. Initially concentrated in Assam, the cradle of the hydrocarbon industry, these refineries are now scattered all over the country, but are particularly well represented in Gujarat and around Mumbai (table 6).
| Status | Name of the refinery | State | Corporation/Company | Capacity (1,000 b/d) |
| Public Sector | Barauni | Bihar | Indian Oil Corp. Ltd (IOCL) | 120 |
| Bongaigaon | Assam | – | 47 | |
| Digboi | Assam | – | 13 | |
| Guwahati | Assam | – | 20 | |
| Haldia | West Bengal | – | 151 | |
| Koyali | Gujarat | – | 275 | |
| Mathura | Uttar Pradesh | – | 161 | |
| Panipat | Haryana | – | 301 | |
| Paradip | Odisha | – | 301 | |
| Mahul | Mumbai | Hindustan Petroleum Corp. Ltd. (HPCL) | 151 | |
| Visakhapatnam | Andhra Pradesh | – | 167 | |
| Mahul | Mumbai | Bharat Petroleum Corp. Ltd | 241 | |
| Kochi | Kerala | – | 311 | |
| Manali | Chennai | Chennai Petroleum Corp. Ltd | 211 | |
| Nagapattinam | Tamil Nadu | – | 20 | |
| Numaligarh | Assam | Bharat Petroleum Corp. Ltd | 60 | |
| Mangalore | Karnataka | Karnataka Mangalore Refinery &Petro. | 301 | |
| Tatipaka | Andhra Pradesh | Oil & Natural Gas Corp. Ltd. (ONGC) | 1 | |
| Joint-Venture | Bina | Madhya Pradesh | Bharat-Oman Refinery Ltd | 157 |
| Bathinda | Punjab | HPCL-Mittal Energy Ltd. | 227 | |
| Private Sector | Jamnagar | Gujarat | Reliance Industries Ltd. | 663 |
| SEZ, Jamnagar | Gujarat | Reliance Industries Ltd. | 707 | |
| Vadinar | Gujarat | Nyara Energy (formerly Essar Oil Ltd.) | 402 | |
| Total | 5 008 |
Table 6. Refinery base 2020 (1,000 barrels/day).Source: U.S. Energy Information Administration, based on India Ministry of Petroleum and Natural Gas. Note: SEZ = special economic zone. EIA (2020) Country Analysis Executive Summary: India. The state of Odisha was called Orissa until 2011.
Some of these companies have also built transportation and distribution networks for refined products. IOCL alone holds about 70% of their capacity, while HPCL evacuates production from its three refineries through a dense transportation and distribution network.
The main result of this downstream oil development is that India is now an exporter of petroleum products. Will it remain so? Given the growth in its oil consumption, some doubt it, judging it difficult to increase refining capacity from 5 to 8 Mb/d by 2025.
4.3. … but extraction is not keeping pace…
In contrast to refining, exploration and production have remained far from the volumes that would have made it possible to achieve a degree of autonomy. After tripling in the first half of the 1980s (see: Energy in India, from Jawarlal Nehru to Indira Gandhi), annual extraction volumes stabilized until the small jump (41 Mt) in the second half of the 2000s, before falling back to around 35 Mt (Table 7).
| Total production | Offshore | Onshore | Rajasthan | Assam | Gujarat | Others | |
| 2014 /15 | 37.5 | 18.9 | 18.6 | 8.8 | 4.5 | 4.7 | 0.6 |
| 2015/16 | 36.9 | 19.2 | 17.9 | 8.6 | 4.2 | 4.5 | 0.6 |
| 2016/17 | 36.0 | 18.4 | 17.6 | 8.2 | 4.2 | 4.6 | 0.6 |
| 2017/18 | 35.7 | 18.1 | 17.5 | 7.9 | 4.3 | 4.6 | 0.7 |
| 2018/19 | 34.2 | 16.9 | 17.3 | 7.7 | 4.3 | 4.6 | 0.7 |
| 2019/20 | 24.4 | 12.0 | 12.4 | 5.2 | 3.1 | 3.5 | 0.6 |
Table 7. Oil production. The Indian year ends at the end of March of the following year. The 2019 year is interrupted in December. Only onshore is geographically distributed. Other states include Andhra Pradesh, Arunachal Pradesh and Tamil Nadu. Source: India Ministry of Petroleum and Natural Gas. Annual Report 2019-2020. Energizing India’s Program, 218 pp.
Crude oil is still extracted half onshore and half offshore, with about 70% of onshore crude coming from Rajasthan and Gujarat (far northwest) and the rest from Assam and Arunachal Pradesh (far northeast), Tamil Nadu (far south), and Andhra Pradesh (east coast). Offshore extraction, mainly from Mumbai High (west coast), continues to decline in 2020. Why such disappointing results? The difficulties are largely geological in origin. In 2020, after decades of exploration, proven reserves will still not exceed 600 Mt, of which 26% will be in Assam, where the first resources were discovered in the 19th century (see: Energy in India, the genesis of its powerful coal industry), 38% in the western offshore, 19% in Gujarat, 7% in the eastern offshore, 6% in Rajasthan and 4% in the other states (Figure 4).
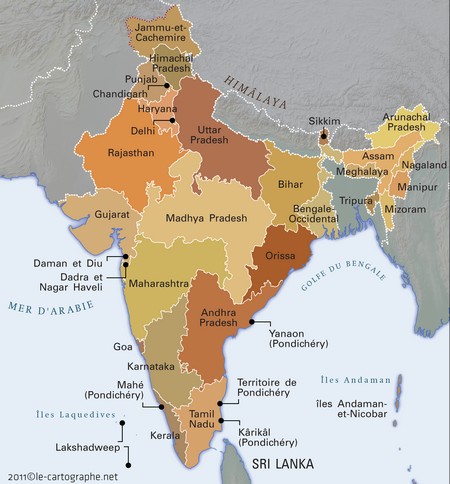
Figure 4. Location of hydrocarbon producing states. [Source: The Cartographer, https://le-cartographe.net/56-fiche-pays/fiche-pays/128-inde-fiche-didentite. Until 2000, Jharkhand was included in Bihar and Chhattisgarh in Madhya Pradesh. Orissa became Orisha in 2011]
Liberalization has not brought the fresh wind that was expected. The contribution of private investors, mostly in joint ventures, has not diminished the dominance of the two large state-owned companies: Oil and Natural Gas Corporation (ONGC) and Oil India Ltd (OIL). The former, which exploits oil and natural gas from 26 sedimentary basins, while managing 11,000 km of pipelines, has launched a major deep-water exploration programme in 2021, but, in general, offshore investments remain insufficient because they are too expensive. To attract more private investors, the government has been granting them new tax facilities since 2019.
4.4. … at the root of the surge in crude oil imports
The combination of limited extraction and a large refinery base has led to a virtual disappearance of oil product imports and a sustained growth in crude oil imports. From 20 Mt in 1990, the latter have jumped to 74 in 2000, 164 in 2010, 203 in 2015 and 227 in 2020, an average annual growth rate of over 8%.
These imports come mainly from the Middle East, which provided more than 60% of the volumes imported in 2020. Saudi Arabia and Iraq are in the lead, to the detriment of Iran, which has been in decline since the imposition of sanctions, and Venezuela and Nigeria, which are considered more risky. If the international situation allows, India would like to restore Iranian imports to their rightful place, accompanied by diversification towards the United States, Canada and Brazil.
In addition, to counter the remaining insecurity, India has built a Strategic Petroleum Reserve (SPR) which, at the end of 2018, had three storage facilities at Visakhapatnam, Mangalore and Padur, containing 39 million barrels (mb), or 10 days of consumption. At that time, the construction of a new 48 Mb reserve was decided. Given the state of knowledge at the beginning of the 2020s, everything suggests that India will remain a major importer of crude oil.
5. The double handicap of the gas industry
Natural gas only entered the Indian energy balance in a significant way in the 1980s because its availability had been doubly limited until then,
– by small quantities of gas extracted in the form of gas associated with oil from Assam, impossible to transport over very long distances, and therefore partially burned in flares;
– by the failure of all import projects using gas pipelines forced to cross hostile countries like Pakistan.
The course of events changed with the start-up of the offshore Mumbai High field discovered by ONGC in 1974. From 2.6 Gm3 in 1980 (see: Energy in India, from Jawarlal Nehru to Indira Gandhi), net production jumped to 12.77 in 1990, then reached 25.4 in 2000 and 46.0 in 2010, the day before its peak (Table 8). During these 30 years, flaring has virtually disappeared, along with gross production that doubled during the 2000s before declining and stabilizing from 2013/14.
| Gm3 | Gross production | Reinjection | Flares | Net production |
| 1990/91 | 18.00 | 0.10 | 5.13 | 12.77 |
| 2010/11 | 52.22 | 5.21 | 0.97 | 46.04 |
| 2015/16 | 32.25 | 5.95 | 1.01 | 25.29 |
| 2018/19 | 32.65 | 6.11 | 0.73 | 25.81 |
| 2019/20 | 31.18 | 6.12 | 0.86 | 24.20 |
Table 8. Natural gas production. Source: Energy Statistics India 2021. Pdf. Note: The above net production is about 10% higher than the BP Statistical Review.
Where did the production jump come from in the 2000s? From the development of new fields, notably Mumbai High, and the development of a substantial network of gas pipelines. In addition to the investments of a few companies in Assam and Gujarat, three players have played a central role in this natural gas breakthrough.
5.1. The dashed hopes of extraction
Transformed from a Soviet-style administrative entity into a public enterprise, ONGC has redoubled its efforts in the Krishna-Godavari Delta (Andhra Pradesh) and the Probandar coast (Gujarat).
Gas Authority of India Ltd (GAIL), established in 1984 with a monopoly on gas transportation, has formed a consortium with Gazprom to explore offshore Bengal, while controlling many pipelines in the northwest of the country, including two major pipelines, Hazira-Vijaipur-Jagadishpur (HVJ), which connects Gujarat to Delhi, and Dahej-Vijaipur. With the inauguration of the Dabhol-Bangalore pipeline in 2013, GAIL plans to integrate southern India into its network.
Reliance Gas Transportation Infrastructure Ltd (RGTIL), a subsidiary of the Reliance Group (RIL), drew on the expertise of Canada’s Niko Resources and commissioned the East-West pipeline in 2009, which connects the Krishna-Godavari gas field to GAIL’s network and to consumption centers in the north and west.
Most of these developments were spurred by the liberalization of the 1990s. Under the New Exploration Licensing Policy (NELP) of 1998, 235 blocks were awarded, resulting in the discovery of 87 oil and gas fields, including, in 2004, Rajasthan, the largest since 1985. It was about time, because between fiscal years 2006-7 and 2010-11, onshore production had fallen back below the 9 bcm mark. The change came from offshore, which, after several years of stability around 24 Bcm, provided 39 Bcm in 2010-11, thanks to RIL’s discoveries in the Krishna Godavari basin[15].
The May 2010 pricing reform and public-private competition have brought about a major shift in the Indian gas industry. The ONGC, which until then had the upper hand in oil and gas exploration, has multiplied its partnerships, from the Gujarat State Petroleum Corp. (GSPC), which has become India’s main exploration company, to multinationals such as ExxonMobil, ENI, BHP-Billiton and BP. In doing so, it acquired 30% of RIL’s assets, including the D6 block in the Krishna Godavari basin and the D4 block in the KG basin.
However, these efforts have not borne all the expected fruits, as net production has regressed since 2011 and in 2020 is back to a level comparable to that of 2000, mainly due to the poor land resources. In 2020, proven reserves are estimated at 1,372 Bcm, of which 41% are in the eastern offshore, 24% in the western offshore, and the rest, including coal bed methane (CBM), distributed between Assam, Gujarat, Rajasthan, Tamul and Trima.
5.2. Gas imports politically constrained
The production-consumption gap, which began in the mid-2000s, has continued to widen and can only be filled by imports, which have risen from 12.93 bcm in 2010 to 21.93 bcm in 2015/16 and 33.89 bcm in 2020, an average annual growth rate of 10%, representing about half of annual gas consumption.
The hope of external gas supply by pipeline was once again abandoned when India’s participation in the Peace Pipeline, designed in the 1990s to supply Iranian gas to the Pakistani and Indian markets, was halted in 2009. In addition to refusing to pay a price that, after transit fees paid to Pakistan, would have reached $7/Mbtu at the border, India no longer wanted a gas pipeline to cross a country accused of the attack on Mumbai in November 2008. The only remaining project in 2020 is the highly uncertain Turkmenistan-Afghanistan-Pakistan-India (Trans-Afghan Pipeline – TAPI) project, 1,700 km long from the Dauletabad fields, which is expected to deliver 90 Mm3/day.
That leaves liquefied natural gas (LNG). Although very expensive, between $10 and $20/Mbtu, imported volumes have risen from 2.8 Gm3 in 2004 to 11.5 in 2010, then 20.0 in 2015 and 32.9 in 2019, representing 55% of total consumption. About half comes from Qatar, the rest from Australia, Angola, Algeria, Nigeria and elsewhere, under the responsibility of Petronet, a joint venture between GAIL, ONCG, IOC and several foreign firms.
Without a political upheaval that could reopen the pipeline route, India will therefore continue to build regasification capacity, increasing the number of terminals from six to 14 during the 2020s. It will probably also seek to sign long-term contracts with Australian or Russian (Gazprom) suppliers, along the lines of the one signed with Qatar’s RasGas.
Could this perspective be modified by the emergence of unconventional gas? Coal bed methane(CBM) production began in 2007 on the basis of estimated resources of 4,600 Gm3 , mainly located in the north, east and west. The most active companies, ONGC, RIL, GAIL, Essar Oil and Arrow Energy, share 26 blocks covering 13,600 km2. The gas they extract is generally marketed as compressed natural gas (CNG), but RIL plans to burn it in its thermal power plants.
Shale gas exploitation is even less advanced. In 2011, ONGC was considering launching a pilot project, in parallel with the huge $1.7 billion investment that RIL made in April 2010 to acquire the technology used in the Marcellus operation in the US.
Even if successful, these new productions will face the problem of extending the national pipeline network. At the beginning of 2020, 16,788 km are in service and 12,672 are under development. Other operators run local pipelines in Assam and Gujarat, but the lack of interconnection is a major factor limiting gas development.
6. New momentum in the power industry
In response to growing electricity needs, the generation capacity of the Indian power industry increased 6.0 times over the period (Table 9). It relies on the State Electricity Boards (SEBs), which are responsible for coordinating generation, transmission and distribution in each state. These are supplied by the National Thermal Power Corporation (NTPC), the National Hydroelectric Power Corporation, the Nuclear Power Corporation and a few other large companies, both public and private, leading the various power sectors.
| MWe | Coal | Gas | Diesel | Nuclear | Hydro | Wind | Solar | Other | Total |
| 1990 | 41 236 | 2 343 | 165 | 1 565 | 18 307 | 100 | 63 716 | ||
| 1997 | 54 154 | 6 562 | 294 | 2 225 | 21 658 | 1 300 | 86199 | ||
| 2002 | 62 131 | 11 163 | 1 135 | 2 720 | 26 269 | 1 900 | 6 | 122 478 | |
| 2007 | 71 121 | 13 692 | 1 202 | 3 900 | 34 654 | 8 800 | 10 | 133 379 | |
| 2012 | 112 022 | 18 381 | 1 200 | 4 780 | 38 990 | 19 100 | 566 | 4 223 | 199 712 |
| 2015 | 169 118 | 23 062 | 1 200 | 5 780 | 41 267 | 26 800 | 3 518 | 5 000 | 275 745 |
| 2016 | 185 172 | 24 509 | 994 | 5 780 | 42 782 | 32 300 | 5 396 | 6 000 | 302 933 |
| 2017 | 192 163 | 25 329 | 838 | 6 780 | 44 478 | 34 100 | 9 647 | 7 000 | 320 335 |
| 2018 | 197 172 | 24 897 | 838 | 6 780 | 45 293 | 35 300 | 17 873 | 8 000 | 331 153 |
| 2019 | 200 705 | 24 937 | 638 | 6 780 | 45 399 | 35 600 | 28 200 | 9 700 | 351 959 |
| 2020 | 205 136 | 24 955 | 510 | 6 780 | 45 699 | 37 700 | 34 600 | 9 700 | 365 080 |
| 2021 | 209 294 | 24 924 | 510 | 6 780 | 46 209 | 39 947 | 40 085 | 15 100 | 382 849 |
Table 9. Evolution of the electric generation fleet. The data are measured on 31 March of the following year. Other” includes small hydro, biomass including bagasse and waste generation. Source: Ministry of New and Renewable Energy. Annual Report. They are extrapolated from 2012 to 2019. These data are imprecise because the Ministry’s statistics are limited in some cases to capacity installed by utilities , excluding that of self-generators.
The system is still dominated by coal-fired power in 2021 (54%), but since the beginning of the 21st century, the share of non-carbon sources has grown steadily to 35-40%. From now on, the share of wind power as well as that of solar power is approaching that of hydraulic power, which has almost stabilized at around 13% if we add the small to the large. In the long run, if the Modi Plan is implemented, the 150 GW of carbon-free power in 2021 should reach 175 GW in 2022 and 450 GW in 2030, but not all sectors will contribute equally to this growth.
6.1. Thermoelectricity and coal still dominant
In the early 1990s, the industry’s delay in investing was the cause of the many power outages that paralyzed economic activity, from a few hours to several days, even in Delhi. The cause was insufficient production capacity, but also poorly maintained networks, losses estimated at 58% of the supply of certain State Electricity Boards and frequent power theft[16].
While 18 GWe were to be built during the 10th Plan (2002-2006), only 6 had been commissioned by April 2006, with a further 9 to be commissioned by the end of the year. The 11th Plan (2007-2011) is therefore more ambitious from the outset: in order to have 200 GWe at its completion, the power industry must build 70 GWe. The NTPC and the former State Electricity Boards obviously remain on line, but private companies are to provide most of the additional power. Since the Electricity Act of 2003, which gives free access to the grid and recognizes trading as a business in its own right, incumbent firms have had a free hand. The Bombay Suburban Electric Corporation, now part of the Reliance Group, has been split into three more efficient companies, particularly in terms of reducing default rates. Tata Power, the Gujarat Electricity Board, Maha Genco and many others are planning to build several GWe of mining and port power plants.
But the government also relies on Independent Power Producers (IPPs), who are more attracted by the new institutional context than the one of the late 1990s. They have been called upon to carry out the Ultra Mega Power Project, which involves the construction of 5×4 GWe, including 2×4 on imported coal, between 2008 and 2012. To facilitate the task of private investors, the public agency PFC has set up a subsidiary on each site, responsible for all administrative formalities, including the purchase of land. A large number of Indian and foreign firms (China, Japan, Korea, France, Germany) responded to the first calls for tender for the Mundra (Gujarat) and Sasan (Madhya Pradesh) projects. However, not all of them have been followed up in an institutional context that is far from being stabilized[17].
As a result of these investments, coal-fired power still accounts for more than 70% of new generation capacity, a far cry from the trajectory that should see coal-fired power accounting for 50% of total generation capacity by 2024, in order to satisfy a 2.9-fold increase in electricity consumption (based on 2005). Moving from one trajectory to the other requires a significant reduction in the energy intensity (commercial sources) of GDP, a profound change in the conditions of access to natural gas, the supply of which is expected to increase by a factor of 7.7 in less than 30 years, and a boom in non-carbon energy sources.
This transformation of the power sector has been hampered by the low efficiency of coal consumption in the Indian power industry (on average 680 gr/kWh compared to 340 in Japan) due to poor fuel quality and poor management of the power plant fleet
(load factor of 66% on average against 85-90% in industrially advanced countries, among others). In addition, but this applies to all electricity consumption, there is an abnormally high loss rate in the transmission and distribution networks.
On the other hand, it has been supported by a faster-than-expected expansion of non-carbon sources[18], including hydro, nuclear, wind and solar.
6.2. Continued hydroelectric development
With the Darjeeling (1898) and Shimsha (1902) power plants, India is one of the pioneer countries in hydropower. Since then, it has equipped about a third of its potential, estimated at 150 GW (excluding pumped storage), distributed mainly between the states of Arunachal Pradesh (50), Uttarakhand (18), Himachal Pradesh (19) and Jammu and Kashmir (14). This expansion was particularly sustained between the early 1990s and the mid-2021s, with the large hydropower fleet increasing from 18 to 46 GW, an average annual rate of 3%. About ten projects exceed one GW, including the Lower Subansiri, the Koyna, the Srisailam and the Nathpa Jhaki. In addition, there are about 5 GW of small hydropower, i.e. projects of less than 25 MW.
However, these developments have not prevented the share of large hydropower in total installed capacity from falling from 29% to 12%, due to the fact that the potential is mainly located in the sub-Himalayan regions, and the difficult climatic and geological conditions increase the already high cost of the initial investment, which weighs on the choices of investors.
However, the sector should continue to grow by at least 20 GW by 2027, based on a remaining potential estimated at around 100 GW, excluding pumped storage, and with a view to a 50% decarbonized electricity fleet. Some 15 GW are already under construction by the National Hydroelectric Power Projects Ltd (NHPPL) and the Himachal Pradesh Power Corporation Ltd (HPPCL), the latter being involved in the development of the Changu River. The constructions on the Narmada, India’s fifth largest river, in the form of a hundred or so small units and a large 150m high dam with a total capacity of 3 GW, have provoked a great deal of controversy due to their social, including religious, and environmental impacts[19]. More generally, Indian projects have aroused the ire of neighboring countries to the east and west. The developments on the Brahmaputra and the Ganges are denounced by Bangladesh. Those on the Indus and its tributaries, which flow through Kashmir before irrigating the Punjab plain, have aroused the hostility of Pakistan to the point of fuelling terrorist threats by jihadists on the theme of “water or blood. To date, the conflict has been avoided thanks to the Indus Treaty signed in 1960 under the auspices of the World Bank[20].
6.3. Consolidation of the nuclear industry
With its two boiling water reactors (BWR) at Tarapur, commissioned in 1963, India, as with hydroelectricity, has also been a pioneer of nuclear power in the developing world.
21] This early development has a history dating back to the initiative of physicist Homi Bhabha who, in 1947, convinced Jawaharlal Nehru to invest in the development of nuclear energy by enacting the Atomic Energy Act the following year and creating the Indian Atomic Energy Commission. In this wake, the Bhabha Atomic Research Center (BARC) launched the construction of a reactor in 1954 in collaboration with Canada, which transferred to India the plans for its experimental reactor at Chalk River, and the United States, which agreed to supply heavy water under the auspices of Atoms for Peace (see: The Non-Proliferation of Nuclear Weapons). In July 1960, the Canada India Reactor Utility Services (CIRUS) went into service (See: Research Reactors). At the same time, under the 123 Agreement (a section of the US Atomic Energy Act establishing rules for international cooperation) between India, the United States and the International Atomic Energy Agency (IAEA), General Electric and Bechtel built the two BWRs (210 MW each, initially) at Tarapur.
This first stage of the Indian nuclear program was interrupted, however, following the “smiling Buddha”, the first nuclear explosion test in the Thar Desert on 18 May 1974, made possible by the plutonium supplied by CIRUS. The transition from civilian to military nuclear power took place in a context of high tensions between India and its neighbours: the Sino-Indian war at the end of 1962, the explosion of the first Chinese nuclear bomb in October 1964, and the war with Pakistan in 1971. After the accidental death of Homi Bhabha in 1966, Raja Ramanna, who succeeded him, no longer hesitated, under the authority of Indira Gandhi, Prime Minister, to push for the development of a bomb, refusing in 1968 to sign the Non-Proliferation Treaty (NPT) and signing a cooperation treaty with the Soviet Union, following the refusal of cooperation by the United States.
Now under embargo, India is “theoretically” forbidden from any trade in nuclear material, civil or military. It therefore opted for a national technology capable of operating autonomously. In the early 2000s, it demonstrated its desire for independence from Western countries and its very friendly long-term prospects, moving from a program of heavy water reactors (PHWRs) to breeder reactors and then to reactors fuelled by thorium, which is very abundant in the Indian subsoil.
Since then, India has built many PHWRs, but it has also returned to international cooperation, after the Nuclear Suppliers Group (NSG) decided in September 2008 to authorize the supply of nuclear technology and fuel for civilian use to India[23]
In the meantime, the National Power Corporation of India Ltd (NPCIL), which operates almost all the nuclear power plants, negotiated an agreement with Rosatom initially to build four reactors, which became 17, half of which were announced on 21 December 2010 before 2017. Of this total, two are to be built in the state of Tamil Nadu. Other agreements followed in 2008: those with the United States give India access to American nuclear technology in exchange for the right to inspection by the International Atomic Energy Agency (IAEA) at its civilian nuclear sites; those with France should lead to the construction of two to six EPRs at the Jaitapur site in Maharashtra, 400 km south of Mumbai[24].
In total, India’s nuclear power capacity increased from about 600 MW in the 1970s to 1,316 MW in 1990, and then to 7,480 MW in 2020, with 22 reactors on seven sites (Table 10 and Figure 1). All are built and commissioned by NPCIL except for the PFWRs (breeders), which are built by another state-owned company, Bhartiya Nabhikiya Vidyut Nigam Limited (BHAVINI).
| Site | Status | Capacity (MW) | Description |
| Tarapur | Maharashtra | 1 400 | 2×160 BHWR (1969) + 2×540 (PHWR) |
| Rawatbhata | Rajasthan | 1 180 | 6x PHWR +Candu Canadian from 1973 |
| Kalpakkam (Madras) | Tamil Nadu | 440 | 2×220 PFBR in 1984 |
| Narora | Uttar Pradesh | 440 | 2×220 PHWR in 1991 and 1992 |
| Kakrapar | Gujarat | 1 140 | 2×700 PHWR in 1993 and 1995 |
| Kudankulam | Tamil Nadu | 2 000 | 2xVVER Russian in 2002 |
| Kaiga | Karnataka | 880 | 4×220 PHWR in 1999, 2000, 2007 and 2011 |
Table 10. India’s nuclear power generation fleet in 2020. Source: Nuclear Power in India. January 2021. https://world-nuclear.org/information-library/country-profiles/countries-g-n/india.aspx. Not all of the capacity built may be in operation, resulting in a higher volume than the 6,780 MW recorded for 2021.
Adding the projected 33,000 MW to the 6,000 MW under construction results in a fleet of over 40 GW between 2030 and 2040 (Tables 11 and 12, Figures 5 and 6). If all the projects go ahead, India’s nuclear fleet will be very diversified: the PFWRs, now called IPWRs (Indian Pressurized Water Reactors), will have to compete with the new Russian VVERs, the French EPRs, Westinghouse’s AP 1000s, BHAVINI’s IFBR, and the AHWR, the prototype thorium reactor.
| Site | Status | Capacity (MW) | Description |
| Kalpakkam (Madras) | Tamil Nadu | 500 | 1×500 PFWR |
| Kakrapar | Gujarat | 700 | Unit 4 IPWR 700 |
| Gorakhpur | Haryana | 1 400 | 2×700 IPWR |
| Rawatbhata | Rajasthan | 1 400 | Unit 7 and 8 IPWR 700 |
| Kudankulam | Tamil Nadu | 2 000 | 2×1000 VVER |
Table 11. Indian nuclear power generation fleet under construction. Source: Nuclear Power in India. January 2021. https://world-nuclear.org/information-library/country-profiles/countries-g-n/india.aspx
| Sector | Capacity (MW) | Sites |
| IPWR 700 | 8 400 | 1,400 at Kaiga (Karnataka), 2,800 at Gorakhpur (Haryana), 2,800 at Mahi Banswara (Rajasthan), 1,400 at Chutka (Madhya Pradesh) |
| VVER | 8 000 | 6,000 in Kavali (Andhra Pradesh), 2,000 in Kudankulam, unit 5 and 6 (Tamil Nadu) |
| EPR | 9 900 | Jaitapur (Maharashtra) |
| AP 1000 | 6 600 | Kovvada (Andhra Pradesh) |
| IIFBR | 1 200 | Madras (Tamil Nadu) |
| AHWR (thorium) | 300 | Tarapur (Maharashtra) |
Table 12. India’s planned nuclear power generation fleet. Source: Nuclear Power in India. January 2021. https://world-nuclear.org/information-library/country-profiles/countries-g-n/india.aspx
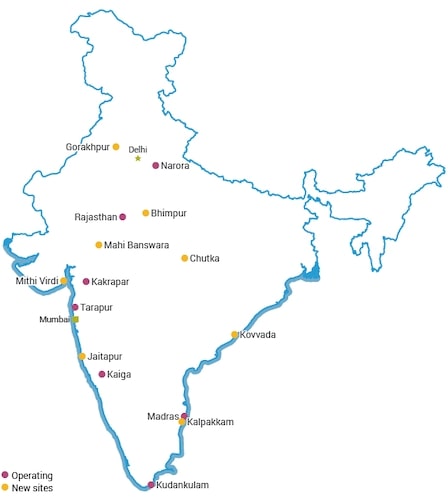
Figure 5: Location of nuclear reactors in 2021. [Source: Nuclear Power in India. January 2021. https://world-nuclear.org/information-library/country-profiles/countries-g-n/india.aspx]
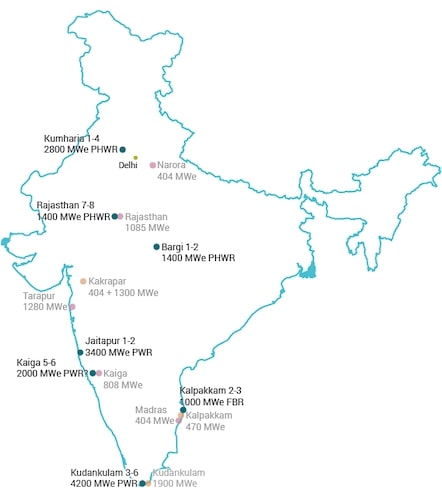
Figure 6: Location of future nuclear reactors. Source: Nuclear Power in India. January 2021. https://world-nuclear.org/information-library/country-profiles/countries-g-n/india.aspx
Regardless of their location, these projects will continue to be contested. Since the mid-2010s, a uranium mine in Andhra Pradesh still cannot be opened. The planned power plant sites of Haripur (West Bengal), Gorakhpur (Haryana), Mithivirdi (Gujarat) and Madban (Maharashtra) still mobilize opponents. In 2011, the most targeted was that of Jaitapur, which, according to some geologists, is located less than 110 km from the epicenter of the Koyna earthquake that occurred nearly 40 years ago. An earthquake of at least 6 on the Richter scale could therefore strike the region again[25].
6.4. Breakthrough of wind power
The contribution of wind power to total electricity generation has jumped from 0.1% in 1995 to 2.0% in 2010, 4.1% in 2019 and 10.4% in 2021.
With an installed wind turbine capacity of 12,965 MW in 2010, India was the 5th largest country in the world in this sector. The first wind turbines were, for the most part, small (50 meters)[26] before the gradual move to more powerful, taller (120 meters) and grid-connected machines. Since then, total capacity has increased almost threefold, unevenly distributed across the country, with concentrations in Tamil Nadu (24%), Gujarat (18%), Maharashtra (13%), Karnataka (13%), Rajasthan (12%), Andhra Pradesh (11%) and the other states (9%). The construction of these plants, almost exclusively onshore, should soon be extended to offshore Tamil Nadu and Gujarat, in order to meet the target of the latest Wind Power Plan, which calls for 60 GWe of capacity by 2022 (Table 13).
Beyond that, on the 7,500 kilometers of coastline highly exposed to wind, the total potential that can still be exploited in India is estimated at 70 GW. In addition to making a significant contribution to centralized electricity production, this energy source is also of interest to the 45% of Indian households that are not connected to the electricity grid; isolated villages can thus be supplied, with some adjustments, by smaller machines. Aware of this potential, the Indian government is strongly encouraging it, with tax credits of 80% for any investment in this field, and an obligation for each state to purchase 5% of electricity from renewable sources. This development is also supported by large groups such as Suzlon Energy (manufacturer of wind turbines), capable of competing with European players such as Vestas.
| Years | Capacity (MW) | Production (TWh) | Years | Capacity (MW) | Production (TWh) |
| 1995 | 940 | 0.5 | 2010 | 13 184 | 19.7 |
| 2000 | 1 267 | 1.7 | 2011 | 16 179 | 24.5 |
| 2001 | 1 456 | 2012 | 17 300 | 30.1 | |
| 2002 | 1 702 | 2013 | 18 420 | 33.2 | |
| 2003 | 2 125 | 2014 | 22 465 | 37.3 | |
| 2004 | 3 000 | 2015 | 25 088 | 41.7 | |
| 2005 | 4 434 | 6.2 | 2016 | 28 700 | 44.9 |
| 2006 | 6 315 | 9.7 | 2017 | 32 849 | 51.0 |
| 2007 | 7 845 | 11.8 | 2018 | 35 300 | 60.0 |
| 2008 | 10 243 | 13.9 | 2019 | 35 600 | 63.0 |
| 2009 | 10 925 | 18.8 | 2020 | 37 700 | 65.2 |
Table 13. Wind power: production capacity and electricity generation. Source: BP. Statistical Review. The capacity noted 1995 is in fact that of 1997.
6.5. Hopes for solar
After wind power, India timidly turned to solar power at the turn of the 21st century, relying on small thermal power plants and photovoltaic installations[27]. The large potential of this source, estimated at 4 to 7 kWh/m2 exploitable from 1,500 to 2,000 hours/year, is largely concentrated in the states of Gujarat and Rajasthan as well as in the Deccan plateau and Kashmir.
It has been developed in two stages (Table 14). Until 2010, it was developed at a moderate pace, reaching a capacity of 3.9 GW and an output of 113 TWh, supported by small-scale village solar thermal plants with a subsidy scheme of Rs 1,500/m2 for water heating, Rs 1,250 for ordinary solar stoves and Rs 2,000 for concentrator solar cookers, all of which have been criticized for their low efficiency.
After the Jawaharlal Nehru National Solar Mission of 2008, the much higher growth rates (900 times production capacity between 2010 and 2020!) are largely due to the construction of very large plants, especially in Gujarat, and the lowering of PV costs to Rs 3 or $0.05/kWh. Now, the authorities prefer a feed-in-tariff ( FiT) incentive such as the one of Rs 15/kWh for 25 years which is applied to solar PV investments from 31/03/2011. It complements the public financing up to 90% of the solar installations “villages” which are not and 100% for households below poverty line (BPL). This impetus should be further strengthened with the establishment of the National Solar Mission (NSM), which has set a target of 1 GW of solar PV and CSP between 2009 and 2013 and 20 GW by 2022. Attracted by the prospect of this development, the Indian industry has begun to strengthen itself to the point that some of its groups are already exporting equipment to countries where the market is more developed, such as Germany and Portugal, even though India continues to import most of its photovoltaic panels from China.
| Years | Capacity (MW) | Production (TWh) | Years | Capacity (MW) | Production (TWh) |
| 1995 | 2010 | 39 | 113 | ||
| 2000 | 2011 | 65 | 863 | ||
| 2001 | 1 | 2012 | 566 | 2 290 | |
| 2002 | 6 | 2013 | 926 | 4 139 | |
| 2003 | 7 | 2014 | 1 336 | 5 852 | |
| 2004 | 8 | 2015 | 3 518 | 10 478 | |
| 2005 | 8 | 2016 | 5 396 | 14 130 | |
| 2006 | 12 | 2017 | 9 647 | 26 035 | |
| 2007 | 10 | 2018 | 17 873 | 39 728 | |
| 2008 | 25 | 63 | 2019 | 28 200 | 46 300 |
| 2009 | 28 | 75 | 2020 | 34 600 | 60 400 |
Table 14. Solar PV: production capacity and electricity generation. Source: BP. Corrected Statistical Review.
With the prospect of 450 GW of renewable capacity in 2030, solar energy is expected to reach 100 GW divided between rooftop installations (40%), large or very large power plants (60%) such as the one inaugurated in Gujarat in 2020 or the one in Badha in the “desert state” of Rajasthan, which has 10 million photovoltaic panels. Part of these capacities will form solar cities and solar parks[28].
7. A coal industry still essential but struggling
Efforts to shift energy demand away from mineral coal to other commercial energy sources have been considerable, but have been unsuccessful: between 1990 and 2020, the share of mineral coal continued to rise, from 55% to 57%, after passing through 59% in 2015, combined with a peak of 76% in electricity generation (Tables 3 and 4). Moreover, this demand has been increasingly difficult to meet by an industry that neither its reorganization since nationalization nor its attempts at liberalization have managed to develop sufficiently (Figure 7).
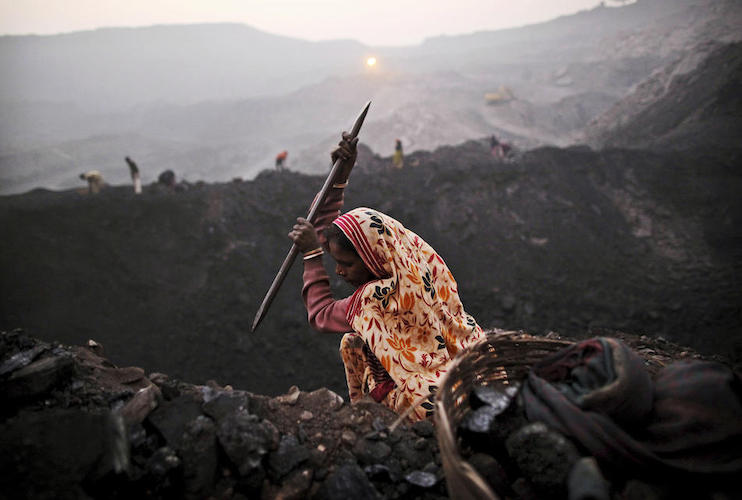
Figure 7. Manual open-pit mining. Source: https://www.lamauvaiseherbe.net/2011/03/11/reportage-photo-dune-mine-de-charbon-en-inde/
How has the coal industry evolved over the past 30 years? What were the obstacles that in 2020 it still has not managed to overcome?
7.1. Sustained growth in national production
The 214.1 Mt extracted in 1990 (Read: L’énergie en Inde, de Jawarlal Nehru à Indira Gandhi) have been multiplied by 3.6 in 2020, i.e. an annual growth rate of more than 4% (Table 15).
| Total production (Mt) | of which lignite (Mt) | of which coking (Mt) | |
| 1990 | 214.1 | 14.1 | 44.8 |
| 1995 | 273.4 | 22.2 | 39.9 |
| 2000 | 313.7 | 24.3 | 30.9 |
| 2005 | 407.0 | 30.2 | 31.5 |
| 2010 | 532.7 | 37.7 | 49.6 |
| 2015 | 639.2 | 43.8 | 60.9 |
| 2018 | 728.7 | 44.3 | 41.1 |
| 2020 | 730.9 | 42.1 | 52.9 |
Table 15. Evolution of coal production. Source. Ministry of Statistics and Programme Implementation (2012). Ministry of Coal (2021). http://coal.nic.in/major-statistics/production-and-supplies.
This increase in production has been made possible by the abundance of coal resources (Table 16). Their volume, estimated in 2017 at 315 billion tons (Gt), is distributed among fifteen or so states, mainly located near the eastern coast: Jarkhand, detached in 2000 from Bihar (86 Gt), Odisha (85 Gt), Chhattisgarh, detached in 2000 from Madhya Pradesh (70 Gt), West Bengal (33 Gt), Madhya Pradesh (30 Gt), among others. 29] About 90% of these are non-coking ores, about half of which are proven.
| Gt | Proven | Indicated | Inferred | Total |
| Coking premium | 4.6 | 0.7 | 0.0 | 5.3 |
| Medium coking | 13.5 | 12.1 | 1.9 | 27.5 |
| Semi coking | 0.5 | 1.0 | 0.2 | 1.7 |
| Non coking (steam) | 124.4 | 125.5 | 30.7 | 280.6 |
| Total | 143.1 | 139.3 | 32.8 | 315.1 |
Table 16. Indian mineral coal reserves. Source: Vishwanathan Saritha S. and others (2018). Coal transition in India, IDDRI, 51 p (p. 10).
The growth is also the result of the shift in extraction towards the richest mining basins (Table 17), and then, within each, towards the most productive mines, because they are very large and can be mined by open-pit. This method of extraction, which was virtually non-existent in 1946, accounted for 28% of production in 1973, 67% in 1990 and 87% in 2020. Initially 150 meters deep, the average depth has evolved to 300 meters, i.e. to better quality ores.
Among the new sites are mines of several tens of millions of tons/year, such as Jharia, West Bokaro or Joyanti in Jharkhand, Ramigang, Dalingkot (Darjeeling) and Birbhum in West Bengal, Korba, Gevra and Kusmunda in Chhattisgarh, Bhubanes, Dipka or Lakhanpur in Odisha. The cost of coal at the pithead is frequently 2 to 3 times lower than in other pits. The opening of these new mines is the result of auctions by the government of blocks.
| Mt/year | 2011 | 2015 | 2020 | 2021 | Tcam 2011/21 |
| Uttar Pradesh | 15.5 | 18.0 | 17.0 | 0.9 | |
| West Bengal | 21.7 | 33.6 | 34.6 | 4.8 | |
| Andhra Pradesh | 50.0 | 52.5 | 65.7 | 52.6 | 0.5 |
| Jharkhand | 105.9 | 119.3 | 1.2 | ||
| Madhya Pradesh | 71.1 | 87.6 | 125.7 | 132.5 | 6.4 |
| Odisha | 102.6 | 123.6 | 143.1 | 154.2 | 4.2 |
| Chhattisgarh | 113.8 | 134.8 | 157.7 | 158.4 | 3.4 |
Table 17. Production trends in the main states. Source: Ministry of Coal. Ceicdata.com/en/india/coal-production-by-major-states. CAGR stands for average annual growth rate.
To exploit them, techniques have evolved. In the context of a transition to open-pit mining, the mechanization of extraction and evacuation of the ore has led to an increase in productivity (tonnage/man/worker) of up to sixfold.
What part did the various components of the Indian coal industry play in this development (table 18)?
| Mt | Total production | of which CIL | of which SCCL | of which captive mines | of which other mines |
| 1990 | 214.5 | 190.0 | 18.0 | 6.5 | – |
| 2010 | 532.7 | 431.3 | 51.3 | 34.2 | 16.9 |
| 2015 | 639.2 | 538.8 | 60.4 | 28.8 | 11.2 |
| 2018 | 728.7 | 606.9 | 64.4 | 49.9 | 7.5 |
| 2020 | 730.9 | 602.1 | 64.0 | 57.9 | 6.9 |
Table 18. Evolution of the coal industry. Source. Ministry of Statistics and program Implementation (2012). Ministry of Coal (2021). http://coal.nic.in/major-statistics/production-and-supplies. Note: SCCL stands for Singareni Coal Company Ltd. The other mines are small rural operations, some of which are illegal (40% of that in Jharkhand?).
With more than 80% of the national production, the Coal of India Ltd (CIL) has retained the quasi-monopoly granted to it by nationalization in 1973. In the early 2010s, it operated 467 mines, of which 270 were underground, 160 were large open pits and 30 were mixed mines. In the following years, apart from the contraction in 2020 due to the coronavirus epidemic, CIL continued to expand at an average annual rate of 3.4 per cent through its subsidiaries (Table 19) and a number of developers-cum-operators (DCOs), who do not own the ore.
| Mt | Opencast | Souterrain (underground) | Mixed | Total |
| Western Coalfields Ltd | 45 | 39 | 2 | 86 |
| South Eastern Coalfields Ltd | 22 | 63 | 1 | 86 |
| Eastern Coalfields Ltd | 18 | 60 | 8 | 86 |
| Central Coalfields Ltd | 42 | 21 | 2 | 65 |
| Bharat Coking Coalfields Ltd | 18 | 13 | 17 | 48 |
| Mahanadi Coalfields Ltd | 18 | 10 | 0 | 28 |
| Northern Coalfields Ltd | 10 | – | 0 | 10 |
| North Eastern Coalfields Ltd | 3 | 1 | 0 | 4 |
| Total | 207 | 176 | 30 | 413 |
Table 19. Number of mines operated by CIL subsidiaries in 2017. Source: Source: Vishwanathan Saritha S. and others (2018). Coal transition in India, IDDRI, 51 p (p. 10).
Alongside CIL, the Singareni Coal Company (SCCL), which had escaped nationalization because it was already publicly owned, stabilized its production volume above 60 Mt in 2015. Since then, it has been overtaken by the captive mines, owned by the large companies extracting coal for their own account: steelmakers such as Arcelor-Mittal or SAIL, and electricity producers such as NTPC, Jindal Power or Essar Power.
7.2. Obstacles to the use of imports
Despite its growth, the supply of Indian coal has been falling further and further behind demand due to the quality of the ore and insufficient investment in productivity. This is due to complicated regulations and the practice of compensating for the unprofitability of certain mines by resorting to public subsidies. This practice had, it is true, been encouraged by a policy of constantly administered prices since 1941, with the exception of a brief interlude from 1967 to 1974[30]. Since 1991, the subsidization of public coal mines has been officially abandoned, followed in 1996 by the partial deregulation of prices for coking coal and most thermal coal[31].
These changes, however, did not give CIL sufficient self-financing capacity to face the growing needs unabashedly. Of course, it has done its best. At the end of March 2007, it had produced 363 Mt and had committed to supplying an additional 140 Mt over the next seven years, thanks to the renewal of some of its equipment, agreements with miners and the priority given to open-pit mines (55 out of 88 projects underway), which are quick to open and have high productivity (7.11 tonnes/man/worker, compared to an average of 0.68 tonnes/man/worker in underground mines). In 2010, it announced that it had identified 142 new mining projects, 76 of which had already been approved, representing an additional 111 Mt of extraction by the end of 2012. However, it has never been able to meet demand, as it has remained trapped in a vicious circle that originates in the dysfunctional States Electricity Board, which has been insufficiently reformed. Obsolete distribution network, under-pricing of electricity, lack of meters, unpaid bills make them unable to pay their supplies to the electricity producers. The latter, who must also over-invest to burn untreated coal (a third of them use fuel containing more than 40% ash), can no longer buy fuel at its fair price. Underpaid, the coal companies have backed away from investments, especially in washing, which brings us full circle.
The other major obstacle to a supply that meets demand has been the insufficient reduction in the burden of transport. As coal production did not develop equally in all EU countries (table 17), the flows to the consumption centers changed. Most of the growth has come from states further west (Madhya Pradesh) and/or further south (Odisha). Add to this the large quantities of lignite mined and burned in Tamil Nadu, and the places of production and consumption have moved closer together. The fuels from West Bengal are now mainly used locally, those from Bihar are mainly sent to New Delhi, Haryana and Punjab, while those from Andhra Pradesh or Odisha supply the southern markets. The large industrial centers of Mumbai and Gujarat find fuel closer to home in Madhya Pradesh.
This development has reduced transport over 1,000 km to less than 30%, in favor of transport between 200 and 500 km, but it has not eliminated the transport burden, which accounts for 80% of production. By what means are they carried out? Volumes by road have doubled, but their proportion has not increased (16%). The Indian Railways still transports 50% of the coal mined in the country, using larger wagons. A more significant change has come from the share of dedicated rail transport set up by the industry: merry-go-round (MGR), which connects the mine floor directly to the thermal power plant tank farm, has grown from 2% in 1977 to 23% of the volumes transported in the 2000s. Since then, it has continued to be encouraged.
Unfortunately, this progress does not mean smooth, low-cost transport of a product that accounts for 48% of freight traffic. Freight costs still account for 70% of the cost of certain deliveries on the West Coast. The responsibility for this lies partly with the coal industry, which continues to transport unwashed coal, but it weighs even more heavily on the railroad network, which since colonial times has been divided into three track widths, on which cars with different axle heights must travel[32]. Moreover, the new wagons are sometimes too wide for the loading and unloading facilities, while the single tracks force freight trains to wait for faster passenger trains. The result is average rail speeds of no more than 20-25 km/hour, which often leads to the temptation to use trucks, which are not much faster, on roads that are “full of potholes with deteriorating surfaces.
To encourage both parties to improve their relationship and thereby increase the efficiency of rail transport, long-term Fuel Supply and Transport Agreements have been devised. The first of these agreements, signed in 2007, stipulated that over a 25-year period, the railways would provide the electric companies with transport capacity (number of wagons) adapted to their needs, and would pay penalties if they failed to meet their commitments. In return, their invoices would have to be paid more quickly. Other routes were therefore explored, such as the continuation of dedicated routes between mines and thermal power plants or the development of maritime transport from the northeast coast to the southeast and west coasts, accompanied by the modernization of old port infrastructures and the construction of new ones: Mundra, Pipavav and Jaigarh on the west coast and Krishnapatnam, Gangavaram and Karaikal on the east coast.
In this context, India has increasingly turned to coal imports, which have jumped from 4.4% of annual consumption in 1990 to 25% in 2010 and 30% in 2020 (Table 20).
| Mt | Exports | Imports | of which cokable |
| 1990 | 6.2 | ||
| 2000 | |||
| 2005 | 50.0 | ||
| 2010 | 2.0 | 102.8 | 31.8 |
| 2015 | 1.6 | 203.9 | 44.6 |
| 2016 | 1.7 | 190.9 | 41.6 |
| 2017 | 1.5 | 208.2 | 47.0 |
| 2018 | 1.3 | 235.3 | 51.8 |
| 2019 | 1.0 | 248.5 | 51.8 |
| 2020 | 0.8 | 215.0 | 51.8 |
Table 20. Evolution of coal exports and imports. Source: Ministry of coal. The fall in 2020 is one of the consequences of covid-19. Exports are limited to a few sales to neighboring countries in the northeast: Bangladesh, Bhutan and Nepal.
At the beginning of the 21st century, they were limited to purchases of coking coals required by the growth of the steel industry, which the domestic coal supply was unable to satisfy. Gradually, they are being extended to thermal coals whose national production has become insufficient, for reasons of quality (ores too ashy), cost and unsuitable means of transport. The 250 Mt imported, before the fall of 2020, come from Indonesia (48%), Australia, which is more expensive but rich in coking coals (20%), South Africa (16%), the United States (6%), Russia (3%) and various other countries (7%) including Mozambique.
To limit this dependence, the federal government has sought to
– to limit this dependence, the federal government has sought to address the lack of washing capacity (see below) and the lack of short- and long-distance evacuation facilities;
– ensure that the pricing system for solid fuels is rationalized and liberalized by a Coal Regulatory Authority (CRA);
– to support CIL in its efforts to modernize domestically and to acquire mines abroad;
– to encourage the owners of “captive mines” to extend their operating perimeter;
– auctioning off new sites, including to foreign capital, through the 2020 “Unleashing Coal” program, which significantly reduces the environmental protections associated with low-grade coal mining.
As of October 2021, these efforts have not yet borne all the expected fruit. Far from being satisfied, coal demand is on the verge of collapse, with more than a hundred thermal power plants having less than four days’ worth of fuel on hand, including fifteen or so that are shut down! In the very short term, little improvement can be expected before March 2022. Import growth is therefore inevitable, despite an unprecedented rise in international prices for Indonesian coal, which in 2021 jumped from $60 to over $200/ton. In the longer term, the institutional framework should continue to be relaxed if India is to attract some of the capital needed for the $2-3 billion in investments, excluding transport infrastructure, that it would need to reach the 1.3 billion t extracted under the Modi Plan by 2030.
But such a prospect seems increasingly incompatible with the necessary progress in environmental protection.
8. Increasingly significant environmental impacts
India’s success in easing the bottleneck in its energy supply leaves the environmental impacts of a still highly carbon-intensive energy balance unresolved, and of concern in four respects: the local impacts of mining activity; the management of increasingly large volumes of ash; air pollution from coal combustion; and rising greenhouse gas (GHG) emissions.
8.1. Local impacts, including forestry, of mining
Underground mines do not have as severe a negative impact as surface mines, but their closure often results in uncontrolled combustion in abandoned shafts, which is harmful locally and globally. The impacts of open-pit mines, which are expanding most rapidly, are much more severe because they result in additional encroachment on forested or cultivated areas. In the 1980s, CIL had to clear 35,236 ha and relocate 3,790 peasant families. Since then, an effort to restore the sites has been undertaken, but by the end of the 1990s, only 31% of the 141,000 ha given over to mining had been reforested.
After having to give up another 44,000 ha of forest to the coal industry in the 2000s, a review of the entire policy took place in 2010. Caught between two requirements, on the one hand, the desire to increase the country’s forest cover from 21 to 30%, and on the other, the observation that 48% of the country’s 68 million ha of forest cover is used for coal mining, the federal government opted to adopt a classification of forest areas into ” go, no-go and may-go “, which is now monitored by a ministerial committee[34].
Since then, people who feel aggrieved by mining projects have been able to seek justice from one of the five “green” tribunals that Jairam Ramesh, the Minister of the Environment, has set up. Every citizen has the right to apply to these tribunals and ask them to fix the amount of compensation in the event of damage caused by the pollution of a site.[35] However, these measures were not enough to stop one of the causes of the deforestation that is fuelling the naxalite rebellion, which is widespread in all the eastern coal-mining states, including Chhattisgarh and Jharkhand-Bihar, and which has complicated the implementation of the Modi program to auction new mining sites in 2020.
8.2. Ash management
According to the Central Pollution Control Board (CPCB), 80% of the coal burned in thermal power plants contains between 24 and 45% ash, 80% of which is released into the atmosphere in the form of fly ash, the other 20% being stored on the surface (bottom ash). Fly ash contributes to air pollution, while bottom ash contributes to land encumbrance and water quality degradation in the vicinity of large thermal power plants.
To limit these impacts, several restrictive measures have been taken or are being considered[36]:
– obligation to wash coals intended for combustion in thermoelectric power plants, since 1997;
– a ban, in June 2001, on transporting unwashed coal over distances of more than 1,000 km;
– a ban on power companies owning power plants located in urban or environmentally sensitive areas from continuing to burn fuels with an ash content of more than 34%, except for combustion in fluidized beds or integrated coal gasification, a measure that has been abandoned because it is unenforceable in the absence of sufficient washing facilities.
In fact, in 2017, there were still only about 60 such plants, with a capacity of 185 Mt, 15 owned by CIL, 19 by steel companies, and 38 by other private companies such as Adani or Jindal.
In this context, how to develop the washing? Some argue that a tax should be introduced in line with the “polluter pays” principle: it would stimulate demand for washed coal and generate revenue to build washing facilities. However, it would only be effective with a reformed power industry, capable of making choices based on its real costs[37]. Perhaps it is this reservation that has led the government to prefer a regulatory measure, namely the obligation to install electrostatic precipitators on new thermal power plants, a measure that many experts consider ineffective.
While China had managed to bury about a quarter of its ash in the ground, India had not exceeded 2% in the late 1990s and had not planned any storage system. By then, however, NTPC had tripled its ash sales, thanks to large state subsidies to recyclers, supplemented or supplemented by federal government subsidies. Aware of these deficiencies, in March 2007, the federal government prohibited the opening of any open-pit mine that was not equipped with a state-of-the-art wash house, but limited it to operations exceeding 2.5 Mt/year that would not burn their coal on the mine floor.
8.3. Air Pollution
Fly ash can produce suspended particulate matter volumes of between 7,500 and 9,000 mg/m3. It may not be the most harmful component of India’s air pollution, however, according to the 2001 report prepared for the World Bank by the Tata Energy and Resources Institute (TERI).
Although air quality measurements began in 1967, reliable data are still scarce, especially for respiratory suspended particles (RSP) of very small size (≤ 10 µg). In the current state of knowledge, SO2 and soot emissions are considered the most dangerous, through acid rain and ozone formation. Both are believed to be responsible for more than 100,000 premature deaths in Indian cities. Acid rain is also believed to have lowered the pH of soils in Bihar, Odisha/Orissa and West Bengal to the point where their fertility is threatened. As early as the 2000s, decreases in wheat yields of between 13 and 50% were observed within a 10 km radius of thermal power plants of 500 to 2,000 MW[38]. In view of these impacts, the only measure in force is the obligation to install a desulfurization plant on thermal power plants of more than 500 MW.
8.4. Greenhouse gas emissions (GHG)
From 1.03 Gt in 2000, India’s GHG emissions reached 1.7 in 2015 and 2.7 in 2019, before a very slight reduction due to the effects of covid-19, the third highest in the world, behind China (9.8) and the United States (4.9)[39]. In relation to the population, these data put into perspective the Indian contribution, which does not exceed 2 tons/inhabitant, compared to 7 in China and 15 in the United States. This contrast justified, until the mid-2010s, the refusal of any reduction commitment, based on the principle of “common but shared responsibilities” according to which the fight against the risks of climate change is first and foremost the responsibility of the countries that have historically increased the concentration of GHG in the atmosphere.
Regardless of any internal evolution, in view of the consequences of climate change on certain parts of the national territory[40], India has since been subjected, like China, to international pressure to limit the growth of its GHG emissions. Hence the Nationally Determined Contributions (NDCs), in the framework of the Paris Agreement (COP 21) of 2015, which provide for a reduction of these emissions by 33 to 35% (2005 base) by 2030. Beyond political declarations of principle, Indian leaders have therefore begun to imagine solutions.
9. Narendra Modi’s dilemma
It was clearly expressed at the end of the United Nations conference in Glasgow (COP 26) in November 2021, when India imposed the replacement of “exit from coal” by “reduction of coal” in the final declaration and only committed to “carbon neutrality” in 2070, i.e. ten years after China and 20 years after the major industrialized countries.
Why such a cautious step towards a clean and low-carbon energy balance? Without exceeding a 50% urbanization rate, India’s population is expected to grow by 270 million by 2040, which will require, among other things, the construction of buildings and urban and inter-city transport, leading to the growth of the steel industry, cement plants and other industries. In this context, it is difficult to imagine annual GDP growth of less than 5-6%. Even including a strong increase in energy efficiency, primary energy demand is expected to grow by at least 2-3% per year.
How can this demand be met? In all the scenarios considered[41], two trajectories seem to be unavoidable: a decline of coal replaced by renewable electricity (nuclear, wind, but especially solar), with a sustained development of the electric fleet. Already foreseen in 2015, these trajectories have been confirmed in 2020, in the form of a fivefold increase in solar electricity production.
But is this realistic, given the intermittent nature of this energy source? To achieve this, a number of conditions must be met: considerable progress in energy efficiency, particularly in air conditioning, the development of thermoelectricity-gas, including biomethane, and the widespread capture and use of carbon. However, it is difficult to bring them all together, according to one of the heads of the Central Mine Planning and Design Institute Ltd, who believes that coal will remain the only source of affordable electricity for several decades to come.
To do so, however, it will have to be burned in an increasingly careful way: a strong focus on energy efficiency in all activities[42]; in situ gasification of coal resources; and the widespread use ofCO2capture and storage[43]. The use of coal free of impurities, the first path to be taken, is progressing slowly but still faces a number of obstacles, mainly economic, and will in any case be insufficient. A second, more ambitious path would be to install only efficient combustion devices in thermal power plants, moving from an average efficiency of 30.5% in 2005 to 39% in the future, thanks to supercritical combustion devices reaching 42%. If this target were achieved, by 2031 India would save 274 Mt of coal. This result would be further enhanced by a drastic reduction in electricity waste and losses (40% in the distribution networks of some states). However, these measures would only contribute to a significant reduction in the GHG emission trajectory if they were part of a longer-term strategy that excluded the total use of coal. But what is the time frame?
Notes and References
Cover images. Make in India. [Source: Prime Minister’s Office (GODL-India), GODL-India, via Wikimedia Commons]
[1] Boillot Jean-Joseph (2016). The economy of India. Collection Repères. Paris: La Découverte, 127 p, (p. 20).
[2] Boillot Jean-Joseph. L’économie, op. cit, p. 15.
[3] Bhattacharyya Subhes C. (1996). The sectoral impacts of the removal of energy subsidies: the case of India. Revue de l’Energie, 479, pp. 376-390.
[4]Boillot Jean-Joseph. L’économie, op. cit, p. 26.
[5] Boillot Jean-Joseph. L’économie, op. cit, pp. 27-29.
[6] Hache Emmanuel (2018). India, the world’s 5th largest economy in 2018 and…? IRIS-France, https://www.iris-france.org/108971-linde-5e-puissance-economique-mondiale-en-2018-et/
[7] Demay Valentin (2018). India, the country of record growth. BFM Business. https://www.bfmtv.com/economie/international/l-inde-le-pays-de-la-croissance-record_AN-201812310144.html. After a 7.3% recession in 2020, the Indian economy is expected to end 2021 up 9.5% according to the IMF.
[8] Zerah Marie-Hélène (2019). When India becomes urbanized. Laviedesidées.fr
[9] Or even 6% if we take into account the fall of about 7% of GDP in 2020 following the corona virus epidemic.
[10] Dorin Bruno and Aubron Claire (2016). Growth and agricultural labor income in India. A political economy of divergence. Rural Economy, 352, March-April.
[11] In 2005, by integrating one of its subsidiaries created in 1918, the Indian Iron and Steel Company (IISCO), the state-owned SAIL group acquired full control of the very large iron ore reserve in Chiria.
[12]Senate (2021). India, a learning giant, https://www.senat.fr/rap/r06-146/r06-1467.html
[13] Lucas Nigel J.D. (1988). India: some aspects of energy policy (pp. 203-220). International Energy, 1988-1989. Paris: Economica, 422 p. Pachauri R.K (2006). India’s Energy Challenge. Public Policy Research, September-December, pp. 200-205.
[14] Yadav Surendra S. and others (1998). Oil industry in India: a study of financial resources management. Revue de l’Energie, 498, June, pp. 316-325.
[15] Sarif Sunil (2010). India’s hydrocarbon deficit. Energy Economist, 350, December, pp. 21-25.
[16] Etienne Gilbert. China-India, op. cit, p. 141.
[17] Subhes C. Battacharyya, after reviewing the progress of the reform since its launch in 1991, analyses its failures and sets out the six criteria (political, financial, economic, social, environmental and practical [implementable]) that should guide the choices of reformers. Bhattacharyya Subhes C. (2007). Sustainability of power sector in India: what does recent experience suggest? Journal of Cleaner Production, 15, pp. 235-246.
[18] Pachaury R.K. India’s Energy, op. cit, p. 204.
[19] Crépin Emilie (2009). “Modern temples”: a large dam in a holy place of the Narmada. Geocrossroads, vol. 84, 1-2, pp. 83-92.
[20 ] On the content of this treatise, one can refer to Bobin Frédéric (2012). China, India and Pakistan are fighting over the water of the Himalayas. Le Monde, March 13.
[21] Hart David (1983). Nuclear Power in India. A comparative analysis. London: Allen & Unwin.
[22 ] Atomic Heritage Foundation (2018). Indian Nuclear Program. Atomicheritage.org/history/indian-nuclear program
[23] Energy & Future, blog 08/02.09
[24] The nuclear situation and projects in India in the mid-2000s are well analyzed in Land Thomas (2005). India’s nuclear power industry in from the cold. Energy Economist, 288, October, pp. 7-9.
[25] Bilham Roger and Gaur Vinod, in Current Science, quoted by Le Monde, December1, 2011.
[26] Pachaury R.K. India’s Energy, op. cit, p. 204.
[27] Naveen Kumar Sharma and others (2012). Solar energy in India: strategies, policies, perspectives. Renewable and Sustainable Energy Review, 16, pp. 933-047.
[28] Wikipedia. Solar energy in India.
[29] The place of these states on the geographical map of India, in figure 4. Note that, apart from differences in definitions, the volume of these reserves per state has changed significantly since the beginning of the 21st century, if we refer to that published in 2005: Madhya Pradesh (72 Gt), Orissa (61), Jharkhand (40), West Bengal (28), Chhattisgarh (19). Suresh Lal B. and Suresh M (2009). Coal demand and supply trend in India: a macro level study. The Andhra Pradesh Economic Association, 22 Feb, pp. 41-49.
[30] Bhattacharyya Subhes (1996). Sectoral impacts, op. cit.
[31] The free market concerns only a part of coal sales, since the large consumer industries (cement, steel, fertilizer, electricity, aluminum, paper, etc.) benefit from purchase quotas at prices at least $20/tonne below market prices. In 2005, the government proposed to extend the free market to all industries that could pass on the price increase to their sales prices, starting with aluminum and paper.
[32] A detailed history of the origins of this aberration can be found in Headrick Daniel R (1988). The Tentacles of progress: technology transfer in the age of imperialism 1850-1940. Oxford University Press, 340 p, (pp. 58-68).
[33] Etienne Gilbert (2007). China-India, the great competition. Paris : Dunod, 232 p, (p. 140).
[34] Indian forest land released for coal mining (2010). Energy Economist, issue 347, September, p. 37.
[35] Only the tribal populations who live off the natural resources of the forest are excluded. Their demands have already forced the cement company Lafarge to abandon the opening of a limestone mine in the state of Meghalaya and possibly another in the state of Himachal Pradesh in the foothills of the Himalayas. Bouissou Julien (2010). India requires manufacturers to be “greener”. Le Monde, October 01.
[36] Kanchi Kohli and Manju Menon (2020). India’s U-Turn on “clean” energy is a bad move. The Wire, June 16.
[37] Chelliah Raja J., Pandey Rita, and Sankar U. (2005). Pricing coal ash for environmental protection. The Journal of Energy and Development, vol. 30, no. 2, pp. 207-221.
[38] Winters Alan L. and Yusuf Shahid (2007). Dancing with Giants. The World Bank, chapter 5, p. 10.
[39] Shukla P.R., Garg Amit, Kapshe Manmohan, Nair Rajesh (2006). India’s NonCO2 GHG Emissions. Development Pathways and Mitigation Flexibility. The Energy Journal, Multi Greenhouse Special Issue, pp. 461-483. Data updated to 2021.
[40] Notably in the form of the effects of accelerated melting of Himalayan glaciers on the 7,517 km of coastline threatened by cyclones and rising sea levels.
[41] The following data is taken from IEA. India Energy Outlook, 2021. Four scenarios are presented: Stated Policies Scenario (policy before corona crisis), India Vision Cases (rapid recovery after crisis), Delayed Recovery Scenario (slower recovery), Sustainable Development Scenario (compliance with the objectives of the Paris Agreement).
[42] A comprehensive analysis of India’s energy efficiency policy compared to China’s can be found in: Ming Yang (2006). Energy efficiency policy impact in India: case study investment in industrial energy efficiency. Energy Policy, 34, pp. 3104-3114.
[43] The Expert Committee on the Road Map for Coal Sector Reforms compares three scenarios to 2031: the business as usual scenario based on coal leads to a consumption of 2.7 Gt, while a very green scenario based on renewables would limit this consumption to 1.4 Gt and, in between, a hydro+nuclear+gas scenario would be at 2 Gt