

Liters of gasoline or diesel purchased at a gas station, kilowatt-hours displayed on the meter in your home: these various energy consumptions are familiar. But what are they really for? It is impossible to know without investigating the needs that energy consumption can satisfy.
Because it is quantified, the consumption of energy products is frequently assimilated to needs, which is not true, since the same need can be satisfied with very different consumption in quantity and quality. To fully understand this divergence, several concepts must be defined, including those of technical systems and energy paradigm that explain the genesis of real energy needs and their evolution.
1. Energy needs: a reductive concept
At some point, wanting mobility often means using a car that itself consumes diesel or gasoline, at so many liters per kilometer driven. Hence the common assimilation between the need for mobility and the need for petrol or diesel. To talk about energy needs in this way is convenient, but reductive, if not incorrect.
Indeed, neither individuals nor companies express a particular need for gas, oil or electricity. The former require mobility or comfort. The latter want to run machines.
To designate the needs that energy consumption makes it possible to satisfy, the notions of real needs for individuals and needs for energy services for the productive system should preferably be used.
2. People’s energy needs: expression of a social norm
The very notion of the real need that energy can satisfy is ambiguous, and needs to be clarified. At the base, of course, we find a physiological notion: eating, drinking, sleeping, being safe; but as societies progress, the notion of need changes. It increasingly encompasses cultural and social dimensions (Table 1).
The needs associated with eating do not mean the same thing in France and rural Africa in terms of energy. Here the freezer and the microwave, there the open and almost continuous fireplace. Talking about the need for mobility or accessibility does not mean the same thing in 21st century France as it did in the 19th century. Today, the horizon is rather that of the European borders, or even the entire planet; yesterday it was often that of the village. The same goes for comfort: everyone now aspires to heat up to 20-22°C in all rooms while until recently, a fireplace or stove in the living room was the norm (Figure 1).
When we talk about the needs that energy can satisfy, we must in fact dissociate two essential notions: the social norm and the distance from it.
Table 1: Typology of human needs that can be met with energy
| Socio-economic function | Needs to be met |
| Food |
– food preparation – food preservation – cleaning, drying |
| “Shelter” |
– heating/air conditioning – hygiene – lighting – ventilation, humidification/drying – surveillance, security |
| Leisure, time for oneself |
– culture – information – communication – games |
| Mobility |
– access to work – access to current amenities: school, shops, places of culture, places of worship,.. – social and family ties – escapades, holidays |
The social norm has two major characteristics: a mode of expression (of need) and an intensity. In France, the current social norm for heating is that of generalized heating of all rooms in the home and a uniform temperature of 20-22°C. The social norm for mobility is to have at one’s disposal at all times a fast mode of travel, most often a car, and to have full freedom to decide and carry out one’s daily activity program wherever one lives: going to work, taking children to school, shopping.

Fig. 1: Traditional cooker – Source: Karsten Paulick, Pixabay
Distance to the social norm is the gap between what we aspire to (the norm) and what we can really do given our resources and the cost of meeting different needs (Read: Une brève histoire de l’énergie). It can be seen that, depending on the needs, the average distance to the social norm is more or less large because it varies with the more or less high equipment rate (ownership of an air conditioner or printer), or the heating temperature. This reflects two related phenomena underlying the dynamics of needs: the imitation effect and income inequality.
The imitation effect reflects the fact that the social norm is generally driven by the wealthier classes of the population: their surplus income allows them to buy something new (Figure 2).
Income inequality, which is precisely the key factor in the evolution of the social norm, is also the average distance factor to this norm: the more recent the evolution of the norm, the greater the average distance to this norm.
At the beginning of the 21st century, there is a growing controversy as to how certain needs are expressed, and therefore the social norms attached to them, and their legitimacy. The Negawatt association, for example, defines certain needs, or more precisely the expression of certain needs, as superfluous, even extravagant (Read: Le scénario négaWatt 2011). This controversy is relevant in that it questions the expression of needs (Table 1) and the correlative evolution of social norms with regard to their consequences on resources and the environment. From this point of view, it must be noted that the physical limits of the planet, such as oil resources or CO2 absorption capacity, are indeed increasingly present (Read: The energy transition : the planet’s greatest challenge).

Fig. 2: Old TV set – Source: Tomasz Mikołajczyk, Pixabay
Behind this question lies the concept of sobriety. It reflects a conscious desire to contain the dynamics of needs to a level of compatibility with the physical limits of the planet, while simultaneously taking into account that distances to social norms will necessarily decrease over time. This decrease will irreparably stimulate an increase in energy needs, even without the emergence of new social norms.
With globalization and the “global village”, the question of social norms takes on a new dimension. In the largely fragmented and uncommunicative world of past centuries, the country-specific cultural dimension far outweighed the setting of social norms, most often in implicit respect for local natural balances. This is no longer the case in a very large part of the current world, particularly in the urban world. Tourism, then television and finally the Internet have revealed to everyone how the needs of the world are expressed, globalizing the imitative effect and frustration of income inequality. In 2015, the Chinese Beijing upper middle class embraced the social norms of need of the United States or Europe, and keeps on desiring to access them. This phenomenon considerably amplifies the subject of the controversy over the relevance of needs: it is easy to show that if all Chinese people had the same standard of living as the average American today, we would need four planets!
3. The needs of the productive sector: expression of a demand for energy services
In the productive sector, there is not strictly speaking a need that energy would satisfy, but a demand for energy services, assimilated here to energy needs, induced by the production of goods and services, and therefore by the creation of wealth that results from it, which requires technical capital (machinery), labor, and raw materials:
- so-called process needs, linked to technical capital: machines, furnaces, boilers, trucks (Read: Les échangeurs de chaleur),
- so-called environmental needs, linked to the working conditions of the workforce,
- raw material requirements, when the latter is an energy product such as gas for nitrogen production or naphtha for petrochemicals.
Depending on the type of productive activity, from heavy industry to tertiary services, the respective share of these three components can vary considerably, and thus the associated energy needs (Table 2).
Table 2: Typology of energy needs in the productive sector
| Production factors | Needs to be met |
| Technical/process capital | – steam production
– furnaces – machines – electrolysis – chemical conversions – automatisms, regulations… – lifting and transport of goods – earthwork – passenger transport |
| Manpower/Environment | – heating/air conditioning
– hygiene – lighting – ventilation, humidification/drying – surveillance, security – information and communication |
| Raw materials | – production of petrochemical bases
– nitrogen production – electrode production – bitumen production – production of various chemicals |
The way in which these energy needs are linked to wealth creation varies according to the nature of the needs.
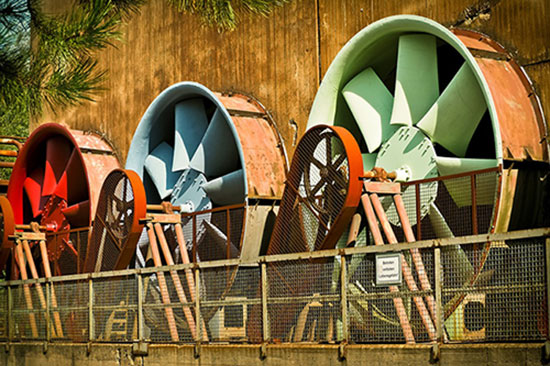
Fig. 3: Process energy requirements – Source: Michael Gaida, Pixabay
Process requirements (Figure 3) are determined mainly by the physical volume of production. But their link with wealth creation depends closely on the link between physical volume and wealth creation, i.e. the economic conditions of production. Less wealth could be created with more energy needs – or the opposite – depending on the evolution of these economic conditions.
Environmental needs are determined fundamentally by the level of employment, but also by existing social standards of comfort and health and, increasingly, by employment productivity gains, including those related to information and communication. Their link with wealth creation depends first of all on the structure of employment between the various economic activities, the link between wealth creation and changes in social norms, and finally on the productivity gains underlying wealth creation.
The needs for raw materials are very closely determined by the physical volumes of the production activities using the raw materials in question. Their link with wealth creation depends closely on the weight of these activities in the economy and, as with process needs, on the link between physical volume and wealth creation, i.e. the economic conditions of production.
4. Energy needs as part of an energy paradigm
In the same technical environment, the assimilation between energy needs and real needs or needs of energy services is acceptable: there is indeed a form of proportionality between mobility or comfort needs and the quantity of energy products required to satisfy them. In other words, the modalities for expressing needs are intrinsically linked to the technical systems and energy services that are part of them. For example:
The need for thermal comfort in winter in France is expressed, in the current social norm, by central heating (or generalized to all rooms). In the most frequent case, it is a technical system coupling a gas supply (and therefore a gas network) or an oil tank (and therefore an oil distribution system), a boiler, a hot water circulator, radiators and a regulator, to which is associated a particular energy service, heat distribution per room.
The need for access to work or the amenities of daily life for someone living in a suburban house is expressed, in the current social norm, by the provision of one or more cars. It is a component of a technical system that includes road infrastructure, parking infrastructure and fuel distribution. The associated energy service is the individualized movement of one or more people at a certain speed, under certain conditions of comfort and safety.
On the other hand, when the technical environment changes, the assimilation between energy needs and real needs or needs of energy services is no longer possible, as everyone has experienced: if I replace my car with a scooter, if I insulate my house, if I produce steel from recycled scrap metal rather than iron ore, the necessary quantities of energy products will be lower, while the underlying needs – mobility, comfort, steel production – will remain the same. At the same time, we may well have an increase in real needs (more kilometers travelled, higher indoor temperatures, higher production) and a decrease in the demand for energy products.
However, since technology is constantly changing, the assimilation of needs that energy allows to satisfy to energy needs, and a fortiori energy demand, is a problem. This is all the more so if we are looking at long time horizons (past or future), during which technical changes are necessarily significant. While an interest in energy needs, in the sense of observed energy demand, is necessary to understand the functioning and dynamics of the energy system, it should not be confused with the actual needs to be met, and should not fail to consider the links between the two.
This question is all the more critical as technical systems are not neutral in relation to real needs. When a person accesses the car, their mobility explodes; when a glass tower is built, the need for air conditioning explodes. And there is a profound link between the energies we mobilize: coal, oil, gas, electricity, and the evolution of technical systems. The car we know is intrinsically linked to oil (we even speak of a lock-in system), just as the steam engine was coal-fired in its early days.
This is what we are talking about as an energy paradigm: the system formed at a given moment by the dominant energies (fossil fuels today), the technologies derived from them, the needs generated by these technologies and the relationship between these needs and the resulting demand for energy products. In other words, the emergence of new modalities for expressing needs generally results from a process of technological innovation, which also leads simultaneously to the imposition of a particular technological system and the associated energy service needs. In many cases, this process of innovation is part of a broader process of development and domination of this or that form of energy: the day before yesterday coal (and the steam engine, or central heating), yesterday oil (and the car), tomorrow, perhaps, renewable energies. Within a given technological paradigm, energy needs are fundamentally expressed through what are called useful energy needs: thermal, mechanical or electrical.
This observation is crucial to understanding the dynamics of energy needs: underpinned by the dynamics of real needs and associated energy services, they are partly determined by the evolution of energy supply and are in no way exogenous to this supply. In the long term, it is therefore incorrect to think in a purely sequential way: (a) what will the needs be; (b) what will the demand for energy be; and (c) how will supply meet that demand? Only the consideration of the whole “needs – demand – supply” in a systemic vision is really relevant (Read: Prospective énergétique : le scénario ANCRE pour la loi de transition énergétique).
Thus, when the energy debate challenges the domination of fossil fuels, for resource and environmental reasons, and defends strong ambitions on renewable energies or nuclear energy, it is part of a challenge to the contemporary energy paradigm, and therefore requires us to question both the needs to be met and the way in which they are linked to the demand for energy products.
5. Can we measure energy needs by energy consumption?
Usually, energy needs are measured by energy consumption, as displayed by energy statistics and energy balances (Read: Le bilan énergétique). This way of doing raises the issue of assimilating needs and consumption.
- Possible distortions between energy consumption and needs
Energy consumption, as recorded by the statistical system, reflects on the one hand the accounting of energy purchases by consumers and on the other hand an estimate of harvest by consumers in nature, wood or solar energy.
Energy purchases result from the meeting of a demand (based on a price) and an offer (also based on a price). In theory, demand reflects the desired quantities as a function of price (Figure 4). In theory, therefore, in the absence of supply constraints, purchases express the intensity of needs for a given price regime. In practice, this assimilation of purchases to needs (for a given price regime) suffers from a double bias: the reality of supply constraints in many countries and the distortion introduced by energy use efficiency.
With regard to energy purchases, supply constraints are mainly of two kinds: failures in the provision of energy (supply cuts) and the lack of access to certain energy sources in certain areas. These constraints are generally inversely proportional to the level of economic development. The resulting biases in the assimilation of consumption to needs are all the more important as the Gross Domestic Product (GDP) per capita is low.

Fig. 4: Calculating energy consumption – Source: Steve Buissinne, Pixabay
In addition, consumption statistics only deal with the quantities of energy products: wood, gas, oil, coal, and electricity that have been purchased or collected, and do not say anything about the amount of useful energy delivered by these products (thermal, mechanical, luminous, electrical, etc.), which may be in different proportions depending on the energies and their use efficiency. Identical needs of useful energy can thus result in different energy consumption depending on the mix of energies consumed. This is another source of bias in the assimilation of consumption to needs, all the more so as the use of low-efficiency energies and technologies (wood, charcoal, peat) is important.
With regard to the direct levy component of consumption, the main supply constraint that can distort the need-consumption relationship is due to deforestation, which is particularly acute in the poorest countries.
Given these possible distortions between consumption and needs, what do energy statistics and balances tell us about the level of needs? Two levels of response will be distinguished here: that of the needs of final consumers and that of a country’s needs.
- Final consumption, reflecting consumers’ energy needs?
As far as final consumers are concerned, one observation must be made: In most cases, final energy consumption statistics (at the level of final consumers) detail only (i) the main consumer sectors (industry, possibly by branch; households; services; transport; agriculture; non-energy uses) and (ii) the main energy sources (oil products, gas, coal, electricity, biomass, biomass, biofuels, district heating, solar energy).
This statistical segmentation of consumption therefore provides us, at best, with information only on the overall level of energy needs of a consumption sector, but not on the actual underlying needs or the associated energy service needs. Statistics on diesel or petrol consumption in transport do not provide us with any information on the transport-energy needs of households, and moreover their mobility needs and the associated energy service needs. Structural refinement of consumption statistics in order to better understand the reality of energy needs (and the underlying real needs) in order to better satisfy them is a crucial challenge for energy policies, both in their “energy efficiency” dimension and in their “supply” dimension.
- Primary consumption as an overall indicator of a country’s energy needs
At the level of a country as a whole, it is the primary energy consumption that is usually used to assess needs. Primary energy consumption includes that of so-called primary energy sources, considered before transformation (crude oil, natural gas, coal, electricity not produced by combustion such as nuclear, hydro, wind, wind, photovoltaic, tidal and other renewable energy sources), plus the import-export balance of derived energy products (oil products, electricity). It goes without saying that this primary consumption can only give a global vision of needs.
But it must also be noted that this vision is very polarized by the mix of energies involved in this primary consumption. For example, depending on whether electricity is produced mainly from hydropower as in Norway, gas as in the Netherlands or nuclear power as in France, the same electricity requirement will result in very different primary energy consumption, in a ratio of 1:2 or 3.
6. How to “read” energy consumption
In addition to the warnings expressed as to their interpretation, energy consumption data should not be used without a minimum of methodological precautions (Read: Le bilan énergétique).
- Commercial consumption
First, let us look at the component of consumption corresponding to the purchase of energy products, which is by far the most reliable. Each commercial energy product is metered, on the basis of which the purchase invoice is drawn up. Metering instruments are of course adapted to different forms of energy: gas, solid, liquid, electricity, heat.
The metering is done in specific physical units: m3, ton, or kWh. Energy accounting then consists in collecting and compiling these data, then retrieving them in standard formats and units, according to precise and universal rules.
For formats, these rules aim to harmonize the content of consumption items according to consumption sectors and energy product categories. For example, it was agreed to account for petrol purchased by households for their cars in the “transport” sector and not in the “residential” (or household) sector.
For units, these rules aim to reduce all specific units of energy products to a single energy unit: physics units (joule or kWh) or energy units (tons oil equivalent, toe, or ton coal equivalent, etc). These units are basically based on the notion of calorific content, i.e. the energy that a combustion reaction is likely to provide according to the laws of physics, the enthalpy of hot water or steam (depending on the temperature difference with the ambient temperature), the heat produced by 1 kWh per joule effect without loss (Read :Les unités d’énergie and Qu’est-ce que l’énergie ?).
For final energy, these rules do not raise any difficulties except that they do not take into account the use efficiencies of these energies and therefore do not allow to reflect the reality of the underlying useful energy.
For primary energies, things are more complicated when the notion of calorific content of certain primary energies is a problem, as is the case for nuclear energy and certain renewable energies. For nuclear power, should we consider the calorific potential of enriched uranium, the heat captured by the heat transfer fluids of nuclear reactors (light water, heavy water, sodium, gas), or the calorific content of the electricity produced? For solar energy, should we consider the solar heat received by the collector surface, the heat captured by the heat transfer fluids of the solar panels or the heat content of the electricity produced? For hydraulics, wind, sea energy, how can we do it? The international rules imposed by the International Energy Agency (IEA) provide precise answers to these questions, but are always subject to discussion and may change over time. In 2020, primary nuclear energy is thus conventionally accounted for from the electricity produced, considering a conventional electricity/heat transformation efficiency of 30%. Primary electricity produced from geothermal energy is accounted for in the same way, but with a conventional electricity/heat efficiency of 10%. Primary electricity produced from water, sun or wind is accounted for with a conventional efficiency of 100%. As shown above, these rules can significantly distort the assessment that one can have of a country’s level of energy needs, and therefore require great caution in interpreting the figures.
- Non-commercial consumption
The other component of energy consumption, that relates to direct harvests from nature, raises different problems.
The first and by far the most important problem is the method used to estimate these harvests. In the absence of a measurement and recording system, it is necessary to rely on other sources of information and other methods of access to information. Most often, other sources of information relate to the equipment used, and access to information is through surveys. The method thus consists in estimating the number of consumers equipped with open hearths, solar water heaters or photovoltaics, and the unit consumption such as the volume of wood per household per week or the surface area of solar panels, then multiplying one by the other to estimate consumption. The quality of the estimate is therefore closely linked to the quality and timeliness of the surveys.
It must be acknowledged that the frequency of surveys, and therefore the quality of the estimates, is often proportional to the level of economic development of a country, whereas the reverse is true for the amount of harvests from nature. Hence this paradox, which must be kept in mind: the greater the proportion of harvests (in relative terms), the more questionable their estimation, and the less information they provide on the reality of needs.
The other complication is the accounting rules applied to energy harvested from nature. For biomass, by far the most concerned energy, the accounting rule for calorific content is confronted with the great diversity of products included in the generic term “biomass”, which is composed of various wood species and many agricultural wastes. Knowledge of the volumes collected can be relatively reliable without their translation into standard energy units being so. In addition, the end-use efficiencies of this biomass are generally very low, which further distances estimated energy consumption from useful energy needs and actual needs. For solar thermal or photovoltaic energy, which is more embryonic but destined for major development, the accounting policy consists in stipulating a certain amount of energy per m2 of collector in a conventional way. This rule certainly has the merit of simplicity, but it faces two obstacles: the lack of knowledge of solar m2 in real working order, and the average real efficiency of collectors. As a result, there are large discrepancies in the estimation of solar energy consumption by source.
7. The variability of energy needs in space and time
If we can only approach the reality of energy needs in time and space through energy consumption, final and primary, we must remain attentive to the possible distortions induced by the statistical system. These reservations being formulated, what do the consumption statistics tell us?
- Economy and climate, the two main causes of spatial differentiation of per capita energy need
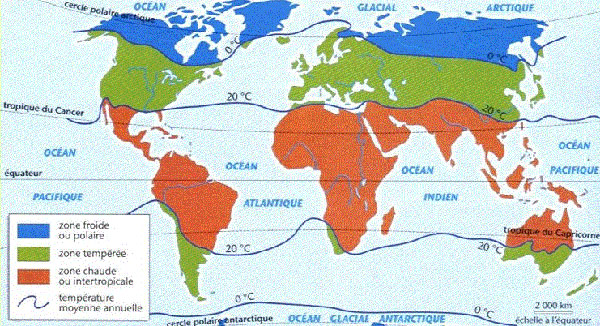
Fig. 5: Map of world climates – Source: www.pass-education.fr
As we have seen, the economy determines the real needs underlying energy requirements, either because of social norms and the average distance to these norms for people, or because of production activity. Among these real needs, those related to comfort (in homes or places of production) induce even greater energy needs (in absolute and relative terms) where climatic conditions are more severe (external temperatures).
The analysis, for a given year, of the energy consumption of different countries in the world located in different climatic zones (Figure 5), and with varying levels of economic development, makes it possible to measure and better understand the respective influence of the economy and climate.
First, consider the link between energy consumption and the level of economic development, as reflected by GDP per capita (GDP/cap), for homogeneous climate zones (similar degree days for tropical, temperate or cold zones) (Figures 6 a, b and c).

Fig. 6a: Final energy per capita in tropical areas – Source: Enerdata
First observation: the differences in energy consumption per capita, and therefore in energy needs, even within the same climate zone, are considerable. Especially if you consider the whole world.
Thus, final consumption per capita in 2012 ranges, depending on the country, from 0.1 toe/cap (Central African Republic) to 6 toe/cap (Canada), a factor of 60 in between.
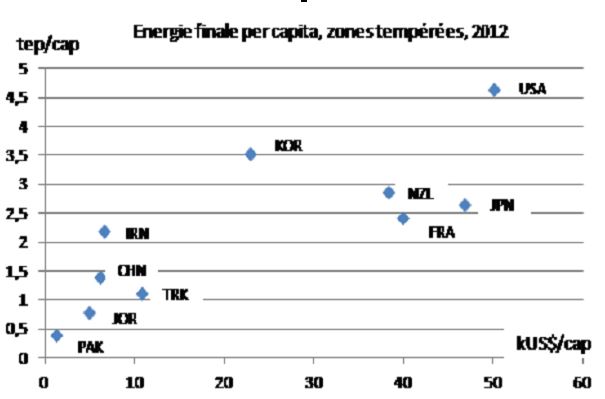
Fig. 6b: Final energy per capita in temperate zones – Source: Enerdata
To set the ideas, 0.1 toe is the energy consumed in one year by three permanently lit 60 W light bulbs, or the energy consumed by an average car to drive 2500 km, or the energy needed to produce 250 kg of crude steel in a blast furnace and an electric steel mill. In contrast, 6 toe is the energy consumed in one year by 180 permanently lit 60 W bulbs, or by a car travelling 150,000 km, or by the energy needed to produce 15 tons of crude steel.
Second observation: There is indeed a certain correlation between final energy consumption per capita and GDP per capita in all climate zones, which makes it possible to understand how energy needs are quantitatively linked to the level of economic development. But these correlations are quite different according to the zones: high in tropical zones, relatively low in the coldest zones, moderate in temperate zones, at least above a certain level of GDP/cap.
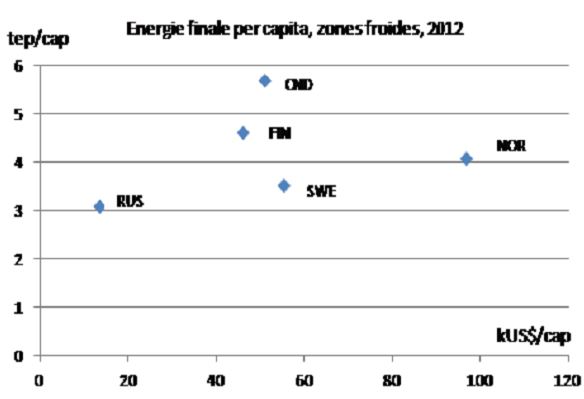
Fig. 6c: Final energy per capita in temperate zones – Source: Enerdata
Another observation, more paradoxical, is that in some slices of GDP per capita where countries in temperate zones and others in tropical zones coexist, per capita energy consumption may be close and the influence of climate on energy consumption may no longer be clear.
It is in fact in the differences in final energy consumption patterns by major sectors of use (Figure 7) that the influence of climate is most clearly apparent, and therefore the specific link between economic development and energy needs. Indeed, it is the consumption linked to energy use in buildings (residential and tertiary) that clearly reveals the impact of climate on energy needs.
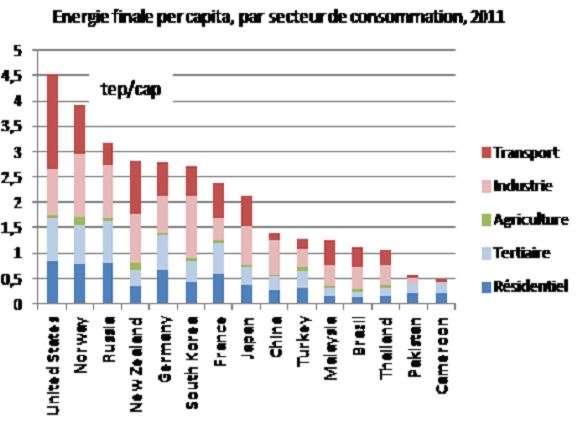
Fig. 7: Final energy consumption worldwide – Source: Enerdata
In countries with cold winters (United States, Norway, Russia, Germany), this consumption is around or above 1.5 toe/cap, while it falls to less than 1 toe/cap in countries with the same GDP per capita but located in more temperate areas. In tropical countries, it is around 0.5 toe per capita or even less, including in the richest countries (Brazil, Malaysia).
The energy consumption of transport and industry shows how the relationship between economic development and energy needs is established.
In the case of transport, where consumption reflects the energy needs associated with mobility, energy needs are very strongly correlated with GDP per capita, although geographical differences, such as the size of countries, can accentuate the phenomenon (United States versus Germany for example).
On the other hand, in the case of industry, above a certain level of GDP per capita, energy consumption becomes strongly decorrelated to GDP: the per capita consumption of industry in Malaysia, Brazil or Thailand is close to that of France or Germany with GDP per capita four to ten times lower (GDP expressed in US dollars at current exchange rates).
In total, if we express the relationship between the growth of energy consumption by industry and that of GDP by a coefficient of elasticity (a value of 1.2, for example, means that energy consumption increases by 1.2% per year when GDP increases by 1%), we can distinguish three main phases in the industrialization process:
- first, a phase of strong growth in the elasticity of industrial energy consumption at the beginning of the industrialization process, due in particular to the development of basic industries
- then the elasticity goes through a maximum when this first phase ends
- finally, this elasticity continues to decrease in the industrial consolidation phase, to become nil or even negative in the post-industrial phase
Each country is obviously a special case due to its mining or agricultural resources, or its industrial specialization strategy, but all of them more or less obey this general correlation/decorrelation movement between industrial energy consumption and economic growth.
- Over a long period, a decoupling between energy consumption and needs
Spatial comparisons have provided initial insight into the links between energy consumption and economic development. This was necessary to understand quantitatively the drivers of energy needs, but insufficient due to the lack of a time dimension. This is for two reasons: (i) the link between energy service needs and energy consumption changes over time, in particular due to technology, as mentioned above; (ii) the content of productive activities and consumer goods and services in a country with a GDP of €1000 / capita today is radically different from what it was in a country with the same GDP/cap (excluding inflation) several decades ago. (Read: Consommation mondiale d’énergie 1800-2000 : définitions et mesures ; Consommation mondiale d’énergie 1800-2000 : les sources d’information and Consommation mondiale d’énergie 1800-2000 : les résultats).
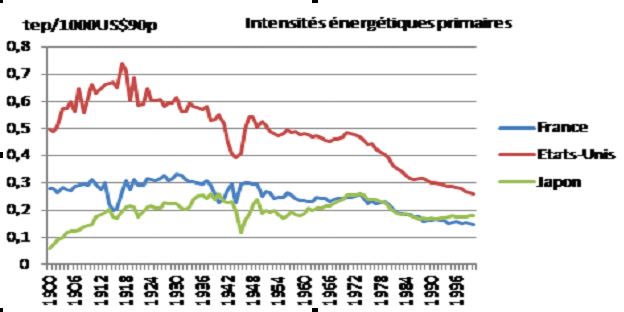
Fig. 8: The primary energy intensity of the major industrial countries in the 20th century – Source: Enerdata
To fully understand this temporal dimension, it is necessary to look at a sufficiently long period of time, if possible in the order of a century (Figure 8).
Only statistics on primary energy consumption in some major industrial countries allow such a perspective to be adopted.
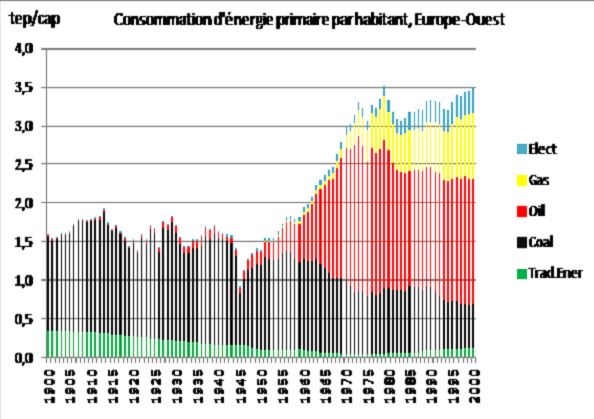
Fig. 9a: The evolution of the structure of primary energy consumption in the 20th century, Western Europe – Source: Enerdata
The historical evolution of primary energy intensity (primary energy consumption divided by GDP) in the United States, France and Japan, but also in other countries, reveals that relatively quickly, in the process of economic development, primary energy consumption is growing structurally at a slower rate than wealth creation. However, there is no evidence that this is true for energy service needs, and a-fortiori for mobility or comfort needs that can be met with energy.
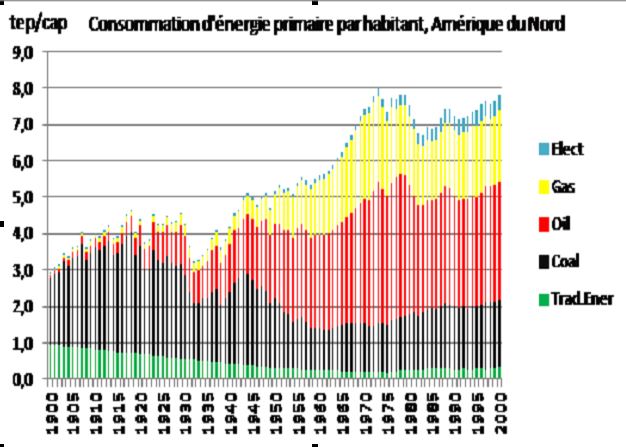
Fig. 9b: The evolution of the structure of primary energy consumption in the 20th century, North America – Source: Enerdata
In both Western Europe (Figure 9a) and North America (Figure 9b), this “decoupling” of primary energy consumption from GDP occurs simultaneously with structural transformations in energy consumption, first in favor of oil, then in favor of gas and primary electricity. However, these energies, which replace coal (and for gas, partially replaces oil), have increasing end-use efficiencies, and make it possible to meet entirely new energy service needs, such as individual mobility or air conditioning, without necessarily increasing energy consumption (Read: Les politiques d’efficacité énergétique : problématiques, moyens et outils d’évaluation).
Bibliography
International Energy Agency (IEA) (2011). ‘’Handbook on energy statistics’’. Paris: IEA
Chateau B. and Lapillonne B. (1977). ‘’Long-term energy forecasting: methodological proposals’’. Paris: CNRS (coll. Energy and Society)
Chateau B. and Lapillonne B. (1982). ‘’Energy Demand: Facts and trends’’. A comparative analysis of industrialized countries. Wien, New York: Springer Verlag
ChateauB. and Alii (2002). ‘’Modelling the dynamics of the needs of energy services in VLEEM’’, Grenoble: Enerdata (VLEEM1 Final report, Annex 1). Available at: http://www.vleem.org/
Chen X. (1992). ‘’Information and energy: The role of information literacy in the relationship between economic growth and energy consumption’’. Thesis in Economics, University of Grenoble.
Darmstadter J., Dunkerley J. and Alterman J. (1977). ‘’How industrialized Societies use energy: a comparative analysis’’. Baltimore and London: The John Hopkins University Press
Goldemberg J., Johannson T.B., Reddy A.K.N. and Williams R.H. (1985). ‘’Energy for a sustainable world’’. Princeton University: Center for Energy and Environment Studies
Martin J.M. (1988). ‘’Energy intensity of economic activity in industrial countries: do very long-term developments provide useful lessons?’’ Economy and Society, (ISMEA publications), April
L’Encyclopédie de l’Énergie est publiée par l’Association des encyclopédies de l’environnement et de l’énergie (A3E) (www.a3e.fr), contractuellement liée à l’université Grenoble Alpes et à Grenoble INP, et parrainée par l’Académie des sciences.
Pour citer cet article, merci de mentionner le nom de l’auteur, le titre de l’article et son URL sur le site de l’Encyclopédie de l’Énergie.
Les articles de l’Encyclopédie de l’Énergie sont mis à disposition selon les termes de la licence Creative Commons Attribution – Pas d’Utilisation Commerciale – Pas de Modification 4.0 International.