
With a total energy consumption of more than 1 billion tons of oil equivalent (Gtoe) in 2020, India ranks third in the world. This position is the result of strong demographic growth but also of a development model and energy supply implemented between political independence in 1947 and the liberal turn in the 1990s. What are its characteristics? Where did the seeds of the liberalization that was to take hold over the next three decades come from?
In 1947, the year of its political independence, the Indian Union, separated from Pakistan, had a population of approximately 340 million inhabitants with a Gross Domestic Product (GDP) estimated at 600 dollars per capita, a third of that of Japan, but 50% more than that of China[1]. About 60% of this product comes from agriculture, which employs more than 70% of the active population; the rest is the result of secondary and tertiary activities, among which industry does not exceed 15%; this last contribution even falls to 6% if we take into account only large modern industry.
This economic underdevelopment is matched by energy consumption of a few dozen kilograms of oil equivalent (koe) per capita, 75% of which comes from traditional sources such as firewood, plant and animal waste, or animal traction. The 25% of so-called commercial sources are mineral coal for 80%, hydrocarbons and hydroelectricity for the rest (Read: Energy in India, the genesis of its powerful coal industry). Already very deficient in the context of a predominantly rural society, this energy base is obviously unsuited to the industrialist vision of the new Indian leaders.
How will they transform this supply by building a modern energy system, still based on mineral coal, the main national resource, but increasingly open to petroleum products, and later to natural gas, all extended by an electricity industry capable of exploiting the atom as well as hydraulic, wind and solar energy?
1. The new institutional context and its evolution
The vision of the economic system that prevailed in 1947 was carried by the Congress Party, whose leader Jawaharlal Nehru had been impressed by the Soviet achievements of the first Five-Year Plans[2] (Read: Le développement énergétique de l’Union Soviétique, 1917-1950). The resolutions of the Lahore (1929) and Karachi (1931) Congresses reflect the orientation of the majority of the Party towards the ideas of planning, public control of large industries and limitation of foreign interests in the economy[3].This Soviet inspiration was tempered, however, by “a Gandhian ideology in favour of rural development,” or “a kind of rural sovietism[4].
Clarified several times in 1944 and 1945, these orientations were officially displayed in the first industrial policy resolution, the Industrial Policy Resolution of April 1948: India opted for a mixed economy in which private capital would have its place, but public ownership would be total in railroads, armaments and atomic energy; in coal, steel, aircraft construction, shipyards, telephone-telegraph and mineral industries, the government reserved an exclusive right over investment decisions; no nationalization would take place for at least 10 years.
The second resolution of 1956 further strengthened the powers of the state: it was granted a monopoly or exclusive right over 16 industries, such as electricity generation, iron and steel, and most mining activities, including coal mining; it had the right to control investment in 12 others, including machine tools, ferroalloys, and fertilizers; and it directed the activities left to the private sector by the objectives of the Plan and the import authorizations.
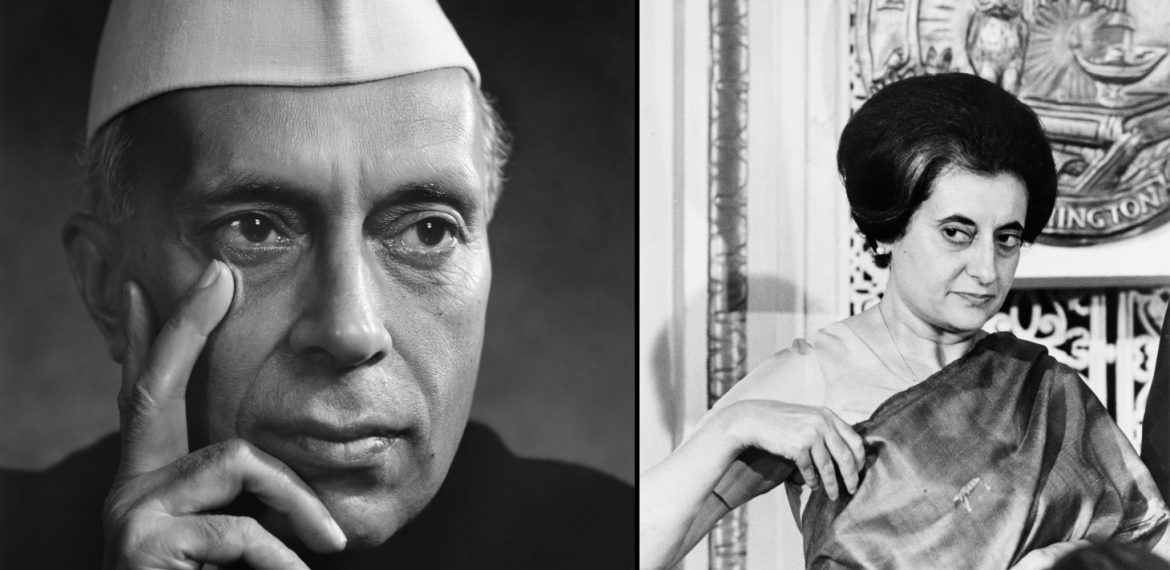
Between the two industrial policy resolutions, planning was put in place: the First Plan (1951-1956) still very much focused on the development of agriculture, then the two following ones (1956-1961 and 1961-1966) whose economic growth objectives were more ambitious and whose socialist orientations were more marked in favor of heavy industries[5]. Jawaharlal Nehru, at the height of his political influence, tried to push the envelope (Figure 1). Unfortunately, he had to contend with poorly anticipated population growth, an agriculture still subject to the vagaries of the monsoon and a dependence on foreign capital and technology that was difficult to overcome. Along with transport, which has been a priority in successive plans, the energy sector is becoming one of the bottlenecks in Indian development.
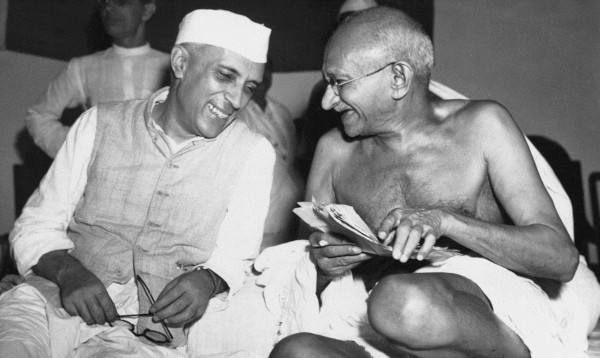
Figure 1: Jawaharlal Nehru with Mahatma Gandhi. [Source: Medium.com]
During the second half of the 1960s, the clouds accumulated: a four-month war against Pakistan, bad monsoons in 1965 and 1966, a serious crisis in agricultural production and therefore in food, inflation, and heightened tensions between political forces. After 20 months of Lal Bahadur Shastri’s government, Indira Gandhi came to power and tried, in an economy forced to open up, to return to a certain dirigisme. In 1969, the 14 largest banks were nationalized; the following year, the third industrial policy resolution refocused state intervention on heavy industries (steel, petroleum, fertilizers); in 1973, the Foreign Exchange Regulation Act (FERA) limited foreign holdings in the capital of Indian companies to 40%. In the meantime, the entire coal industry had been nationalized[6].
In the early 1990s, the nationalization of the economy came to an end. Following a somewhat turbulent political period, marked in particular by the assassination of Rajiv Gandhi, who had succeeded his mother in 1984, the appointment of P.V. Narasimha Rao as Prime Minister and Manmohan Singh as Finance Minister gave a boost to the liberalization of the Indian economy.
2. Energy, population and economic growth
Estimated at around 100 million tonnes of oil equivalent (Mtoe) in 1950, India’s primary energy consumption had almost quadrupled by 1990, representing an average annual growth rate (aGr) of just over 3% (table 1).
Table 1. Evolution of total energy consumption in India. [Source: BP Statistical Review and our estimates.] The 1950 data differ slightly from those in Table 2, in Energy in India: The Making of its Powerful Coal Industry, mainly because of the conversion of electricity consumption to toe.
| Non-commercial consumption (Mtoe) | Share of this consumption (%) | Consumption consumption (Mtoe) |
Share of this consumption (%) |
Consumption consumption (Mtoe) |
Tcam from commercial sources (%) | Tcam total(%) | |
| 1950 | 85 | 80 | 19.5 | 20 | 104.5 | – | – |
| 1955 | 91 | 79 | 24.5 | 21 | 115.5 | 4.7 | 2.0 |
| 1960 | 98 | 75 | 33.3 | 25 | 131.3 | 6.3 | 2.6 |
| 1965 | 109 | 67 | 52.6 | 33 | 161.6 | 9.6 | 4.2 |
| 1970 | 119 | 65 | 64.8 | 35 | 183.8 | 4.3 | 3.0 |
| 1975 | 131 | 62 | 81.8 | 38 | 212.8 | 4.8 | 2.6 |
| 1980 | 147 | 59 | 102.3 | 41 | 249.3 | 4.6 | 3.2 |
| 1985 | 155 | 54 | 133.4 | 46 | 288.4 | 5.5 | 3.0 |
| 1990 | 169 | 46 | 198.9 | 54 | 367.9 | 8.3 | 5.0 |
This energy growth is inseparable from the increase in the total population from 361 million in 1950 to 870 million in 1990, i.e., at a rate of 2.2% per year, but also from economic development, resulting, among other things, in a shift from so-called non-commercial or traditional energy sources to commercial or modern sources, from 80%-20% in 1950 to 46%-54% in 1990.
Throughout the period, the former prevailed in the thousands of villages that remained faithful to a traditional community organization and continued to draw the energy they needed to feed themselves, work the fields, make their daily utensils and get around from biomass and animal traction. In the countryside, “women harvest cow dung either in the form of dried patties as fuel or used as fertilizer. Most of the houses are made of adobe, lit by candle or kerosene lamp”[7]. How to estimate this part of the energy consumption? On the basis of an urbanization rate increasing from 17 to 26% (Table 2), the rural population increased from 300 million inhabitants (Mh) in 1950 to 644 in 1990, but it had to rely less and less on traditional sources as modern sources (mineral coal, diesel, electricity) penetrated the countryside, i.e., consumption of the former decreased from 235 koe/capita in 1950 to 194 in 1990 (Figure 2).
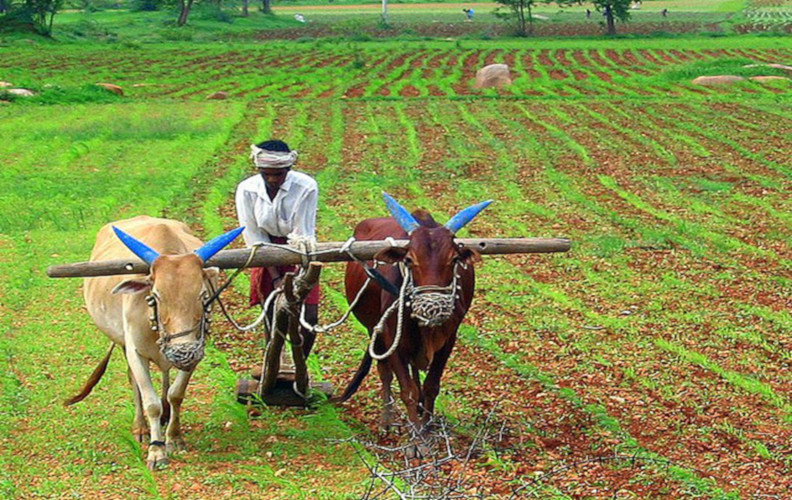
Figure 2. Animal traction in rural energy
Much faster, the growth in consumption from so-called commercial sources, which increased tenfold, i.e., an average annual growth of 6% with peaks close to 10%, was driven by urban expansion, industrialization and the explosion in the movement of people and goods, all of which were expressed in a fivefold increase in GDP in constant dollars (Table 2).
Table 2. Population and economic growth. [Source: Angus Maddison (2001). The World Economy. OECD, 400p, for POP and GDP. M means million and G billion].
| Population
M |
Urbanization
% |
GDP Constant $B |
Primary activities % |
Secondary % |
Tertiary % |
|
| 1950 | 361 | 17 | 222 | 59 | 15 | 26 |
| 1960 | 450 | 18 | 327 | 41 | 21 | 38 |
| 1970 | 554 | 20 | 470 | 40 | 23 | 37 |
| 1980 | 697 | 23 | 637 | 33 | 31 | 36 |
| 1990 | 870 | 26 | 1 098 | 27 | 36 | 37 |
In this context, the government has steadily increased the share of its investments devoted to the development of modern energy sources, from 16.4% (1960-65) to 18.9% (1966-75) and 21.6% (1976-1980). Of this total, investments in electricity generation and transmission, especially to the rural areas, were the most significant[8].
3. The rise of so-called commercial energy sources
What energy sources has India turned to in order to meet its growing need for modern energy sources? Primary sources (Table 3), some of which have been converted into electricity (Table 4).
Table 3. Evolution of consumption of primary commercial sources. [Source: BP Statistical Review, completed by us]. The total of commercial sources is given by column 3 of Table 1. The electricity consumption in this table is only the so-called primary consumption, which is almost exclusively hydroelectricity.
| Coal (Mtoe) | % | Oil (Mtoe) | % | Gas (Mtoe) | % | Electricity (Mtoe) | % | |
| 1950 | 15.0 | 77 | 3.9 | 20 | – | – | 0.6 | 3 |
| 1955 | 19.0 | 78 | 4.5 | 18 | – | – | 1.0 | 4 |
| 1960 | 26.0 | 78 | 5.2 | 16 | 0.1 | – | 2.0 | 6 |
| 1965 | 35.5 | 67 | 12.6 | 24 | 0.2 | 1 | 4.3 | 8 |
| 1970 | 37.6 | 58 | 19.5 | 30 | 0.5 | 1 | 7.2 | 11 |
| 1975 | 48.1 | 59 | 23.3 | 28 | 0.9 | 1 | 9.5 | 12 |
| 1980 | 56.7 | 55 | 31.6 | 31 | 1.0 | 1 | 13.0 | 13 |
| 1985 | 73.7 | 55 | 43.3 | 32 | 3.7 | 3 | 12.7 | 10 |
| 1990 | 109.7 | 55 | 57.9 | 29 | 14.8 | 7 | 16.5 | 9 |
In order to increase the share of its so-called commercial sources from 20% to 54% of a total energy consumption that increased 3.5-fold between 1950 and 1990 (Tables 1 and 3), India has continued to rely mainly on its mineral coal production, but it has also moved towards a more diversified energy balance.
- Coal consumption increased more than sevenfold, and it remained indispensable for all the uses it could satisfy, from cooking and home heating in regions where this was justified, to consumption by energy-intensive industries (steel, cement, chemicals) and the production of manufactured gas or electricity.
- At the same time, urbanization and the expansion of road transport are driving the growth of petroleum product consumption, but the share of this energy source will never exceed 32% of total commercial consumption, for reasons related to the deficiencies of the Indian oil industry (see below).
- Even more timidly, natural gas did not really enter the Indian energy balance until the 1980s.
- Significant efforts have been made to develop hydroelectricity, but the remoteness of the sites that can be equipped and the cost of the investments have not made it possible to go very far down the road of primary electricity while waiting for nuclear, wind and solar photovoltaic power.
Well above the growth in consumption from primary sources, the growth in gross electricity generation jumped from 7.1 TWh in 1950 to 287.8 TWh in 1990, an annual rate close to 10 percent, and increasingly relied on thermal generation, mainly fuelled by mineral coal (see below).
How did India achieve these results? What were the stages and modalities of building its energy industries in the evolving institutional context of the first four years of its independence?
4. The difficult adaptations of the coal industry
The Indian coal industry was not disrupted by political independence and the India-Pakistan partition of 15 August 1947, but the profound changes in its institutional environment were to gradually alter its trajectory. The 2.0% average annual growth rate since 1920 jumped to 4.1% between 1950 and 1970 and then to 6.0% between 1970 and 1990 (table 4). This acceleration was accompanied by organizational changes, the focal point of which was the nationalization of the coal industry between 1971 and 1973[9].
Table 4. Coal production 1945-1990. [Source. Henderson P.D. (1975). India: The energy sector. A World Bank Publication, Oxford University Press, 188 p (p. 45), supplemented by us].
| Hard coal (Mt) | of which coking coal (Mt) | Lignite (Mt) | |
| 1950 | 32.8 | ||
| 1955 | 38.8 | 14.3 | |
| 1960 | 52.6 | 16.7 | 0.05 |
| 1965 | 67.2 | 17.0 | 2.3 |
| 1970 | 73.7 | 18.0 | 3.5 |
| 1975 | 95.9 | 18.0 | 2.8 |
| 1980 | 111.0 | 18.1 | 5.1 |
| 1985 | 150.5 | 25.8 | 7.8 |
| 1990 | 211.2 | 36.1 | 14.1 |
Until 1985, India lived in quasi-autonomy with very limited exports and imports (less than 2 Mt/year), which were in balance. During 1985, the former remained stable while the latter began to grow, until it exceeded 6 Mt in 1990 (Annex 1). Despite its reorganization, the national industry is struggling to meet demand. Why is this so?
4.1. The limited success of the First Plans
In the decade following independence, the new governments were aware of the bottleneck of insufficient energy supply. As early as 1950, they established a Working Party for the Coal Industry to propose to the government the broad outlines of a coal policy. The following year, this body recommended a zonal development of production, additional coal transport facilities, a concentration of loss-making mines, and prior government approval for any mine opening.
Production growth was modest during the First Plan (20%) but rose during the Second Plan (36%). Almost 80% of the enterprises remained private thanks to the exceptions provided for in the 1948 industrial policy resolution, but they were supervised by a Coal Controller. The opening of new mines is carried out within the regulatory framework defined by the Mines and Minerals Regulation and Development Act of 1957, supplemented by the Mineral Concession Rules of 1960, which apply to all mining activities except oil and natural gas. Alongside the private sector, however, a public sector was being set up. As early as 1948, the State of Andhra Pradesh created the Singareni Collieries Company (SECL), in which it holds 60% of the capital, alongside the central government, which owns 39% through the Coal Mines Authority (Figure 3).
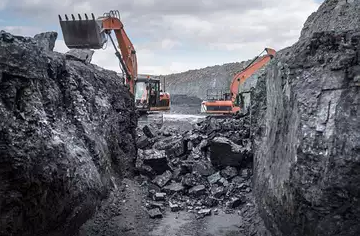
Figure 3. Singareni collars. [Source: Energy News]
In 1956, the Second Resolution and the Second Five-Year Plan accentuated the government’s desire for public control over coal mine development. It resulted in the creation of an Amalgamation Committee responsible for organizing the merger of small, unprofitable mines into units of at least 10,000 tons/year on a surface area of 100 acres: after the failure of the voluntary approach (22 agreements out of approximately 500 mines concerned), the operation became mandatory. The political will was also expressed by the institution of the Coal Production and Development Commissioner (CPDC) and the setting up of the National Coal Development Corporation (NCDC) responsible for bringing together various public mines belonging to the railway companies or to certain States of the Union and for rapidly increasing extraction, especially in the outlying regions. The entry of public capital into the coal industry was not enough, however, to boost growth, which was running out of steam: 36% from 1955 to 1960, 28% from 1960 to 1965 and 10% from 1965 to 1970. Actual production was moving further and further away from the objectives of the five-year plans: 54 Mt instead of 60 Mt in 1961-62; 68 Mt instead of 97 Mt in 1965-66.
4.2. Nationalization
The organizational change began in October 1971 with the integration of all the coking coal mines into the new state-owned Bharat Coking Coal Limited (BCCL), followed by their formal nationalization in May 1972. The thermal coal mines followed shortly afterwards: in accordance with the Coalmines Nationalisation Act of May 1973, they joined, together with the former state-owned mines of the National Cooperative Development Corporation (NCDC), the new Coal Mines Authority Limited (CMAL).
From then on, all Indian coal mines came under three public entities: the Singareni Collieries (SCCL), the CMAL and the BCCL, the latter being attached to the administration of the Steel Authority of India Limited (SAIL), before all the coal companies were placed under the authority of the Ministry of Energy, created in October 1974. The following year, CMAL and BCCL formed Coal India Limited (CIL), a holding company of eight companies with territorial jurisdiction [10]. In addition to the SCCL, another public company developed outside the CIL fold: the Neyveli Lignite Corporation Ltd, 6% of whose capital is in the hands of private shareholders, will use highly mechanized means to exploit the lignite deposits in the state of Tamil Nadu, in the extreme south of the country, for the benefit of a large thermal power plant (Table 5).
The only mines that escape the public sector are those of steel companies (officially since 1976), certain electricity companies (since 1993) and then cement companies: Tata Iron and Steel Company (TISCO), Indian Iron and Steel Ltd (IISCO), Damodar Valley Corporation (DVC), Jammu and Kashmir Minerals Ltd (JKML), Bengal Emya Coal Mines Ltd (BECML), Bihar States Mineral Development Corporation (BSMDC) and a few others fall under these exemptions. All these companies extract 5% of India’s coal, but they can only use it to meet their own needs, which justifies the name “captive” given to their mines [11].
Table 5. Organization of the CIL. [Source: CIAB Coal, op. cit, p. 47.] North Eastern Coalfields Ltd is managed directly by CIL.
| States | Number of mines | Production
(Mt) in 2000 |
% production
open-pit |
|
| Bharat Coking Coal Ltd | Bihar, West Bengal | 109 | 26 | 64 |
| Central Coalfield Ltd | Bihar | 71 | 31.8 | 90 |
| Eastern Coalfields Ltd | West Bengal, Bihar | 119 | 28 | 53 |
| Mahanadi Coalfields Ltd | Orissa | 22 | 44.8 | 95 |
| Northern Coalfields Ltd | Madhya Pradesh
Uttar Pradesh |
9 | 41.4 | 100 |
| South-Eastern Coalfields Ltd | Madhya Pradesh | 78 | 60.3 | 72 |
| Western Coalfields Ltd | Western States | 97 | 35.2 | 70 |
| North-Eastern Coalfields Ltd | Northern States | 6 | 0.7 | 72 |
| Coal India Ltd | 518 | 268.2 |
Throughout this period, successive governments have done nothing to penalize a demand for coal that has been favored by prices that have remained very competitive. It is not, therefore, primarily on the demand side that we must look for the causes of the loss of dynamism in coal growth. The shortages of solid fuel suffered by the steel industry, the cement industry in Tamil Nadu and Gujarat, and the thermal power plants in West Bengal in the early 1970s are proof of this [12]. The brakes are on the supply side, both in the transport and in the processing and extraction stages (Figure 4).
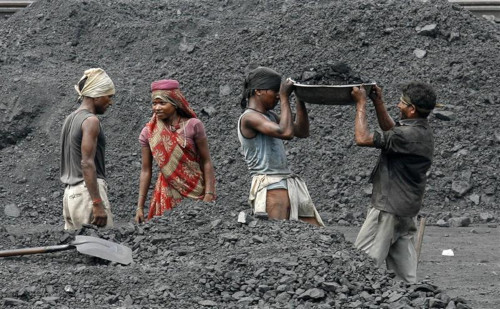
Figure 4: Some archaic aspects of Indian coal mining. [Source: Afriexporter. https://www.google.com/search?q=India+coal+industry&source=lnms&tbm=isch&sa=X&ved]
The nationalization of the coal mines coincided with the first oil crisis and the preparation of the Fifth Five-Year Plan (1973/74-1978/79). In a country that had still not managed to produce volumes of crude oil equal to its needs, the rise in international oil prices was an additional handicap on the road to industrialization. While setting an ambitious target of 11.4 Mt of crude oil (+58%), the Fifth Plan relies mainly on coal, whose production it wants to increase to 135 Mt (+73%). This result was far from being achieved in 1978-79 (barely over 100 Mt), but after the stagnation of the previous decade, growth was back. During the two five-year periods following 1980, it reached 6.3% and 6.9%. How did the state-owned enterprises, which now provide more than 95% of production, put the Indian industry back on the path of expansion?
4.3. The coal industry’s shortcomings
The obstacles to further growth in mining lie in the organization of the industry, the state of the technology used and the management of the companies.
At the end of the first two five-year plans, the Indian coal industry is still fragmented among 800 mining plants, a third of which produce less than 6,000 tons per year! Overall, labor productivity is very low and is increasing only slowly: from 136 tons/man/year (background and day) in 1961 to 190 in 1971, an average annual growth rate of 3%. This is largely due to mining methods: open-pit mining is still limited to 20% of total production; mining is still mainly carried out at the peak; 36% of volumes are mined by coal cutters in 226 mines, but mechanized loading is used only in 22 of them (3% of total production), and conveyors in 39 (10%).
In addition, there were numerous work interruptions due to power cuts or unused production capacity due to lack of rails or spare parts. These deficiencies would have forced one large open-pit mine to work for 5 years at 50% of its capacity [13]. Underinvestment? Undoubtedly, but for what reasons? On top of a lack of interest in mechanization, which was not encouraged by the low wages of the miners, there was undoubtedly the unwillingness of the mine owners after the second industrial policy resolution of 1956, which placed coalmines among the 16 industries under the monopoly of the public authorities. The latter were certainly beginning to take over, but in too small a step to replace the failing dynamism of the private sector, whose production stagnated from 1965 onwards and then fell back after 1969.
A reorganization of the extraction plants followed shortly after nationalization. The oldest or smallest ones, mostly on the Raniganj and Jharia deposits, were closed or merged. The 300 operating sites of the former were reduced to 86. In coke-making, Bharat did the same, reducing from 388 to 87. By the 1980s, the public sector was down to 300 plants, each mining an average of 240,000 tonnes/year. Since then, the number of its underground mining sites has increased slightly, but as concentration has continued, their average production has reached 500,000 tons/year. The decisive change, however, has come from elsewhere, i.e. the opening of numerous open-cut mines: there are 164 of them, with an average annual production of 2 Mt and even 5 in the case of lignite (Figure 5). Since its creation, the Indian state-owned industry has spent $2.3 billion on open-cut mines, compared with $1.5 billion on underground mines, and owes most of its production and productivity growth to them (Table 6).
4.4. Productivity increase
From 50% higher than underground mines during the 1970s, the productivity of open-pit mines is almost 10 times higher at the turn of the 21st century [14]. Surface mining has been almost entirely mechanized, using shovels and trucks when the overburden (low stripping ratio) is not too thick, and draglines with 20 to 30 m3 buckets when it is too thick (Figure 5). Once the quarry is open, the coal is dug up by excavators with a capacity of 5 to 20 m3 and carried away by heavy dumper trucks with a capacity of 35 to 170 tons. In underground mines, the share of mechanized mining has increased from 3 to 40% of all Indian mines, but it has encountered geological obstacles. The longwall was introduced in 1978 in the Moonidih mine in the Jharia deposit, but by 1992, CIL and SCCL had equipped only 20 workings, of which only half were in operation [15]. Edge and pillar remained the most common mining method until the early 2000s: 69% (Bharat Coking Coal Ltd), 83% (Central Coalfields Ltd), 81% (Eastern Coalfields Ltd), 51% (Mahanadi Coalfields Ltd), 30% (South-Eastern Coalfields Ltd). Under this mining method, mechanization rates vary from mine to mine, but are generally quite low, especially at the ore evacuation stage.
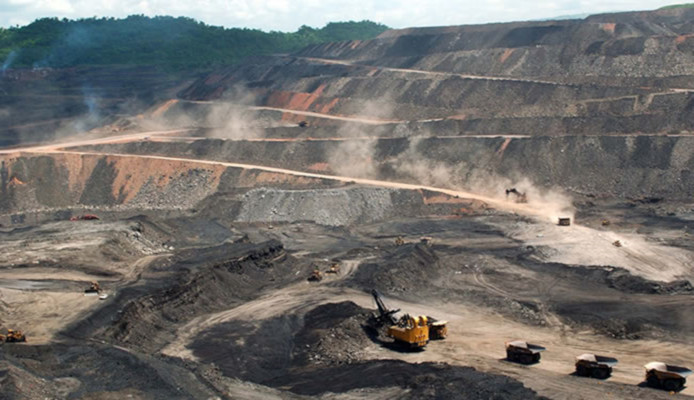
Figure 5. Open pit mines. [Source: Basta]
Most of India’s coal production suffers from high ash content, which hampers combustion and unnecessarily inflates the volumes transported. Systematic washing of ores, which could overcome this obstacle, has never been achieved.
This handicap particularly affected coking coals. While they still represented nearly 40% of total production in the early 1950s, they had fallen to 25% by 1965. Moreover, in order to be cooked in good conditions, they need to be sorted and washed. In order to meet the objectives of steel production growth, the Second Five-Year Plan had planned the construction of a large 2-Mt washing plant to serve the Rourkela and Bhilai steel plants, followed by another of similar capacity near Durgapur. The delays in their construction were such that, at the end of 1959, they were still not completed, while the new coke ovens were already in operation and had to be supplied from abroad [16].
Increasing the extraction of low-quality coals would only be half a success, without additional means to treat them before carbonization or combustion. Especially since deeper extraction in the oldest deposits, such as Jharia, has resulted in an increase in the ash content of the coals (from 18-24% to 26-37%), well above the levels accepted by the integrated Indian coking plants (17%). Initially tempted to let the steel companies adapt their installations to the quality of the fuels delivered, the coal companies gradually took the measure of the stakes and installed washing facilities for coking coals [17]. Since the mid-1990s, they have been making steady progress towards the washing of thermal coals. Reducing the ash content offers several advantages: it reduces the cost of transport by avoiding the movement of unnecessary volumes of material (in mid-1990, 10% less ash saves $4/ton transported over 1,000 km, i.e. almost the cost of washing estimated at $5/ton); it increases combustion efficiency because the specific coal consumption is reduced from 0.77 to 0.53 kg/kWh.
Table 6. Open Pit versus Underground Productivity 1975-1990. [Source: CIAB Coal, op. cit, 108 and ICR. 11 November 1994.] Productivities are given in tons/man/shift. These are the CIL figures, which are not very different from those of the Singareni.
| % open air | Productivity open sky | Productivity underground | Total Productivity | |
| 1975-76 | 23.4 | 0.90 | 0.60 | 0.65 |
| 1980-81 | 32.1 | 1.50 | 0.50 | 0.70 |
| 1985-86 | 53.7 | 2.24 | 0.53 | 0.92 |
| 1990-91 | 67.1 | 3.31 | 0.53 | 1.30 |
4.5.5. Transport still deficient
Faced with industrial users, many of whom are located in Maharashtra (Mumbai) or Gujarat (Ahmedabad), the concentration of 80% of India’s coal production in West Bengal and Bihar implies massive recourse to fuel transport, 90% of which is carried out by rail [18]. It is therefore not surprising that one third of rail transport capacity was taken up by coal traffic and that the latter became increasingly deficient to the point of paralysing certain coking and cement plants, while stocks sometimes accumulated on the mine floor. Among the many causes of these deficiencies were strikes by railway workers, poor coordination between coal and rail companies, poor management of an obsolete fleet of cars and a lack of infrastructure. Were the planners responsible? Probably, if one blames the transport bottleneck on the fall in rail investment from 1964 onwards [19]. However, the latter also coincided with the beginning of a difficult period, both economically (the Third Five-Year Plan had to be abandoned) and politically (the Sino-Indian conflict shortly before the death of Jawaharlal Nehru).
The delicate problem of transport has also been complicated by several developments since nationalization. As coal production did not develop equally in all the states of the Union, the flows to the centers of consumption changed. The two major eastern producing states, which accounted for 65% of India’s coal production in the mid-1970s, have increased their production since then (from 66 to 96 Mt, from mines in Bihar), but now account for only 30.8% of total consumption. Most of the growth has come from states further west (Madhya Pradesh and more recently Uttar Pradesh) and/or further south (Orissa, Maharashtra and Andhra Pradesh). If one adds the large quantities of lignite mined and burned in Tamil Nadu, there is a clear proximity of production and consumption locations that limits the length of the routes. In the early 1990s, fuels from West Bengal were used mainly locally, those from Bihar mainly to New Delhi, Haryana and Punjab, while those from Andhra Pradesh and Orissa supplied the southern markets. The large industrial centers of Mumbai and Gujarat find fuel closer to home in Madhya Pradesh.
This has not eliminated long-distance transport, but it has reduced transport over 1,000 km to less than 30%, while transport between 200 and 500 km is more than 60%. By what means are they carried out? Road volumes have doubled, but their proportion has not increased (16%). The Indian Railways still carry 50% of the coal mined in the country, using larger wagons. A more significant change has come from the share taken by dedicated rail transport, set up by the industry: merry-go-round, which links the mine floor directly to the thermal power plant stockyard, has increased from 2% in 1977 to 23% of the volumes transported in the late 1990s (Figure 6). Could these volumes be reduced by concentrating the power plants on the mine floor? Probably, but not beyond a certain level of concentration, if excessive pollution is to be avoided.
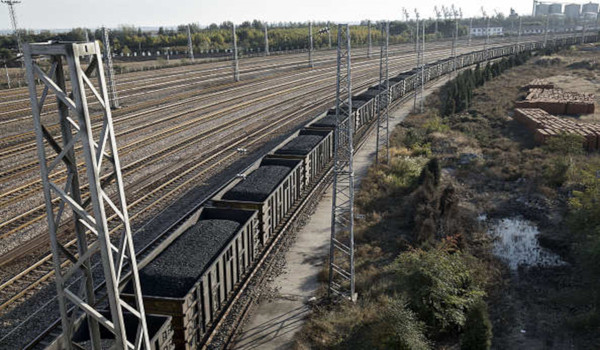
Figure 6. Continuous coal train. [Source: ETEnergyworld.com]
The progress made does not mean, unfortunately, the fluidity and low cost of transporting a product that represents 48% of freight traffic. Freight still accounts for 70% of the cost of some deliveries on the West Coast. The responsibility for this lies partly with the coal industry, which continues to transport unwashed coal, but it is even more of a burden on the railroad network, which since colonial times has been divided into three track widths, on which cars with different axle heights have to travel [20]. Moreover, the new cars are sometimes too wide for the loading and unloading facilities, while the single tracks force freight trains to wait for faster passenger trains. The result is average rail speeds of no more than 20-25 km/hour, which often leads to the temptation to use trucks, which are not much faster, on roads that are “full of potholes with deteriorating surfaces [21].
5. The penetration of oil in the energy balance
Although relatively closed, the Indian economy has not been immune to major global energy developments. New motorization patterns and the advantages of burning oil products over coal in many domestic and industrial uses have favored oil, whose share in the commercial energy balance has risen from 20% in 1950 to 30% since the early 1970s (Table 3).
5.1. Uneven growth in oil product consumption
The average annual rate of 7% of oil consumption over the whole period is the result of the surge in the 1950s (8% per year) and 1960s (almost 10%), followed by a more moderate rate of less than 6%, largely influenced by the 3% in the years of the first oil shock in 1973 and 1974 (Table 7).
Table 7. Evolution of consumption of various petroleum products. [Source: 1951-1961: P.D. Henderson, India, op. cit, pp. 51-52.] For more information: Ministry of Statistics. Energy Statistics 2013. Other light products include LPG. Other heavy products include petcoke.
| Mt | 1951 | 1961 | 1970-71 | 1980-81 | 1990-91 |
| Light products | 0.91 | 1.00 | 2.53 | 4.26 | 9.42 |
| Essence | 0.82 | 0.88 | 1.45 | 1.52 | 3.55 |
| Naphtha | – | – | 0.90 | 2.33 | 3.45 |
| Others (including LPG) | 0.09 | 0.12 | 0.18 | 0.41 | 2.42 |
| Average products | 1.90 | 4.59 | 8.90 | 16.83 | 32.75 |
| Kerosene | 1.06 | 2.20 | 3.28 | 4.23 | 8.42 |
| Diesel | 0.72 | 2.05 | 4.93 | 11.47 | 22.65 |
| Others | 0.12 | 0.34 | 0.69 | 1.13 | 1.68 |
| Heavy products | 1.09 | 2.67 | 6.10 | 9.26 | 11.75 |
| Fuel-oils | 0.90 | 1.89 | 4.66 | 7.47 | 8.99 |
| Lubricants | 0.18 | 0.36 | 0.55 | 0.59 | 0.89 |
| Bitumen | – | 0.41 | 0.78 | 1.06 | 1.58 |
| Others | 0.01 | 0.01 | 0.11 | 0.14 | 0.29 |
| Total sales | 3.90 | 8.27 | 17.53 | 30.35 | 53.92 |
| Refinery and losses | 0.03 | 0.14 | 1.61 | 1.93 | 3.83 |
| Total | 3.93 | 8.41 | 19.14 | 32.28 | 57.75 |
Not all petroleum products contribute equally to this growth:
– the share of kerosene, which dominated in 1951, 27% of total oil consumption, declined fairly steadily to 6% in 1990-91, as oil lamps and stoves were abandoned due to urbanization or access to electricity in the countryside [22];
– the share of fuels, on the other hand, increased from 39% in 1951 to 45% in 1990-91, but while gasoline consumption did not grow by more than 3.8% per year over the entire period, diesel consumption (high speed and light) grew by nearly 10%, resulting in a much higher share of these products in India (47% of total oil consumption in 1972) than in the United States (29%) and Western Europe (32%); this is due to the increasing dieselization of rail, river, maritime and especially road transport (78% of high speed consumption in 1978), in parallel with the spread of small generators used in industry and for pumping water in the countryside;
– fuel oils, on the other hand, are growing by an average of 6% per year, especially in thermoelectricity, but they are losing ground, falling from 23% of total oil consumption in 1951 to 16% in 1990-91, because they are competing with cheaper mineral coal in large-scale thermal uses;
– the remaining oil products are used for purposes other than combustion, such as lubricants, tars and naphtha for the chemical industry, which is increasingly consumed with the expansion of the latter from the 1960s onwards. However, their share will not exceed 8% of total oil consumption in 1990-91.
In response to the growth of these markets, India is first developing its refinery and then trying to reduce its crude oil imports by expanding its crude oil extraction.
5.2. Refining development
Very early on, during the last two decades of the 19th century, India tried to meet its demand for kerosene with oil extracted from its subsoil, via the Burmah Oil Company (BOC), which exploited and refined crude oil extracted in Assam and the Punjab at Digboi. However, by getting closer to the Anglo-Persian Oil Company, which became British Petroleum (BP), the BOC had preferred, between the two world wars, to import Iranian crude and petroleum products (Read: Energy in India, the genesis of its powerful coal industry).
As a result, India’s refining capacity is no longer growing. In the early 1950s, 95% of the 3.93 Mt of petroleum products consumed were imported by foreign companies, which charged exceptionally high prices for their products. “Thus, in 1956, the price of petrol in India (excluding transport costs and domestic taxes) was 35% higher than in London, despite the proximity of supply sources[23]. The new increase in June 1957 cost the Indian consumer more than 60 million Reis (MRs) and contributed to the growing foreign trade deficit.
To limit such dependence on imported petroleum products, the development of refining was necessary. The 0.30 Mt refined in 1950 reached 20.81 in 1974 and more than 50 in 1990. This expansion was based first on private investment, then public investment from the mid-1960s, and finally mixed investment (Table 8).
Table 8. Origin of refining capacity. [Source: P.H. Henserson, India, op. cit, p. 58.] The above data correspond to production, which was slightly lower than capacity, which in 1974 reached 24.5 Mt.
| Mt | 1950 | 1960 | 1970 | 1974 | 1978/79 |
| Private | 0.30 | 6.09 | 7.47 | 5.68 | |
| Public | – | – | 6.34 | 7.28 | |
| Mixed | – | – | 4.65 | 7.85 | |
| Total | 0.30 | 6.09 | 18.46 | 20.81 | 32.40 |
The three refineries in operation in the second half of the 1950s were those of Burmah Shell and Esso at Mumba, and Caltex at Vishakhapatnam on the east coast (Figure 7). This fleet was completed in the following decade by the two state-owned refineries that were built under the Second Plan, namely Nunmati or Gauhati (Assam) with Romanian assistance, Barauni (Bihar) with Soviet assistance and Koyali (Gujarat). All these refineries were operated by the Indian Refineries Private Ltd (IRPL) with a capital of 300 MRs until its integration into the Indian Oil Company (IOC), also known as Oil Indian Ltd (OIL), created in June 1959.
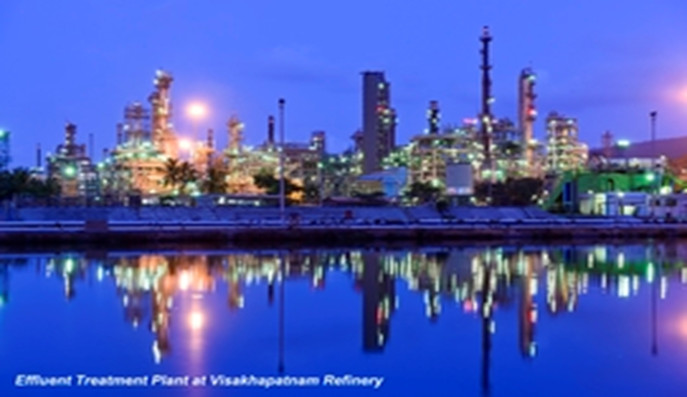
Figure 7. Vishakhapatnam refinery. [Source: https://www.alamyimages.fr/photo-image-raffinerie-de-petrole-visakhapatnam-andhra-pradesh-inde-asie-90376217.html]
It was at this time that production also began at the various refineries built jointly with public and private capital: the Cochin refinery, 52.4% of which is controlled by the public sector and 26.4% by Phillips Petroleum; the Madras refinery, 74% of which is controlled by the public sector and 13% each by the National Iranian Oil Company and Amoco. This private-public mix is completed by the state’s participation in the refining companies of Esso, Caltex and Shell. In addition to the expansion of capacity at Barauni, Madras and Koyali (+4.3 Mt), the construction of new refineries at Haldia (2.5 Mt), Bongaigon (1.0 Mt) and Mathura (6.0 Mt) followed during the 1970s.
The main result of these developments is the fall in the share of imported petroleum products in total consumption, from 90% in 1950 to about 15% in 1980. The same cannot be said for the extraction of crude oil for refining.
5.3. The difficult development of crude oil extraction
After independence, crude oil production, which was almost entirely under the control of a private company, the Assam Oil Company (AOC), a subsidiary of the BOC, was not a priority in industrial development projects financed by public funds. During the First Five-Year Plan (1951-56), 450 million Reis, or 15% of total public funds, were allocated to refinery development, but crude oil production was not included in the list of activities financed. Exploration, however, benefited from some initiatives:
– a geological and mining research program was entrusted to several organizations: the Geological Survey of India (GSI), the Indian Bureau of Mines (IBM), the Petroleum and Natural Gas Commission and various national laboratories;
– under an agreement concluded in 1953 and 1955, the Indian State joined the research undertaken in West Bengal by the Standard Vacuum Oil Company Ltd;
– research and exploitation licenses were granted to AOC, whose production increased during the first half of the 1950’s.
With the Second Plan (1956-61), public interest in oil increased. Following the creation in 1955 of an Oil and Natural Gas Division in the Ministry of Natural Resources, and later a Ministry of Mines and Fuels, the government began to focus on the oil industry:
– about 70 million MRs of public funds are devoted to oil research, which also benefits from significant cooperation from the Soviet Union;
– the Oil and Natural Gas Commission (ONGC), created in 1956, has exclusive exploration and production rights in all onshore basins, except for a few areas in Assam reserved for the AOC and the IOC;
– an agreement is concluded between the State and the BOC to exploit a new deposit discovered in Assam and to build and use a pipeline.
The result: after the near-stagnation of the 1950s, crude oil production increased more than tenfold in the 1960s, and then fivefold in the following decades. Under the leadership of the ONGC and the IOC, Indian crude oil production became overwhelmingly state-owned (Table 9).
Table 9. Evolution of crude oil production. [Source: up to 1974, P.D. Henderson, India, op. cit.] For the rest: Energy Statistics, op. cit. Unfortunately, this directory does not specify the share of each company.
| Mt | AOC | IOC or OIL | ONCG | Total |
| 1951 | 0.269 | – | – | 0.269 |
| 1956 | 0.307 | 0.089 | – | 0.396 |
| 1961 | 0.184 | 0.319 | 0.010 | 0.513 |
| 1965 | 0.158 | 1.742 | 1.122 | 3.022 |
| 1970 | 0.107 | 3.070 | 3.632 | 6.809 |
| 1974 | 0.072 | 3.080 | 4.338 | 7.490 |
| 1980/81 | 10.510 | |||
| 1985/86 | 30.170 | |||
| 1990/91 | 33.020 |
However, this production is still very far from satisfying a demand that reached 20 Mt in the early 1970s, then 60 Mt in 1990 (Table 8), which forces imports to become increasingly costly [24]. While the AOC is limited to exploiting the Digboi field in Assam, and the IOC is confined to 3% of this same territory, the ONGC is stepping up its onshore and offshore exploration efforts.
In India, the company is developing the Mumbai High zone in the Cambay Basin, which Soviet geologists had deemed worthy of interest both in terms of reserves and lower operating costs than those of Assam.
Outside India, ONGC is forging alliances with foreign companies to control sources of crude:
– its privately owned subsidiary Hydrocarbons India Ltd is partnering with the National Iranian Oil Company (NIOC), Ente Nazionale Idrocarburi (ENI) and Phillips Petroleum Company, to explore 8,000 sq km offshore in the Gulf;
– in November 1973, the Iraq National Oil Company (INOC) entrusted ONGC with the exploration of 4,500 km2 near the neutral zone of Kuwait.
Following the first oil crisis of 1973, 45% of the credits initially included in the 5th Plan were earmarked for exploration, of which 8.4 Mt were expected from the ONGC, which should make it possible to increase national production to 11.4 Mt in 1978/79 from 7.2 Mt in 1973/74. Given the possible reduction in volumes extracted at Ankleshwar (Gujarat), ONGC will have to push ahead with drilling in Assam at great depth (4,500 metres), with new fields brought on stream both onshore and offshore in the Cambay Basin, and with the extension of its pipelines, including the Salaya-Koyali-Mathura pipeline (1,400 km) between the Gujarat coast and northern New Delhi.
6. Access to natural gas from the 1980’s
Until the 1980s, with annual consumption of less than 1 Mtoe, natural gas had little impact on the Indian energy balance (Table 3).
On the demand side, two uses dominate, electricity generation and nitrogen fertilizer production, but while the share of the former declined from 40% to 28%, that of the latter increased from 29% to 44% between 1970 and 1990. The remainder is destined for industry and households, but the share of the latter never exceeds 10% [25].
On the supply side, until the late 1970s, natural gas came from its association with crude oil production in Assam or from small quantities of dry gas from the Cambay basin in Gujarat [26]. Because of this origin, and in the absence of a transportation network, more than half of the raw production is either reinjected or mostly flared (Table 10).
Table 10. From production to net production (consumption) of natural gas. [Source: Energy Statistics 2013, p. 29]. Indian statistics equate net production with consumption. Note some slight differences in production from other data: 139 Mm3 (0.4% of consumption from commercial sources) in 1960; 400 Mm3 (0.7%) in 1965. Darmstadter Joel (1971). Energy, op. cit, pp. 641 and 677. It reached 1.4 Gm3 in 1980.
| Gm3 | Gross production | Re-injection | Flares | Net production |
| 1965 | 0.74 | – | 0.39 | 0.35 |
| 1970/71 | 1.45 | 0.04 | 0.76 | 0.65 |
| 1975/76 | 2.37 | 0.16 | 1.08 | 1.13 |
| 1980/81 | 2.36 | 0.07 | 0.77 | 1.52 |
| 1985/86 | 8.13 | 0.07 | 3.12 | 4.94 |
| 1990/91 | 18.00 | 0.10 | 5.13 | 12.77 |
The gross production trajectory began to rise in the second half of the 1970s, following the development of the offshore Mumbai High field discovered by ONGC in 1974, but annual production volumes did not exceed 20 bcm in the early 1990s, the ONGC, which was transformed from a Soviet-style administrative entity into a public company, redoubled its efforts in the Krishna-Godavari delta (Andhra Pradesh) and on the Probandar coast (Gujarat), but it was no longer alone. Gas Authority of India Ltd (GAIL), created in 1984, has formed a consortium with Gazprom to explore offshore Bengal, while Reliance India Ltd (RIL) is relying on the expertise of Canadian company Niko Resources. In addition, GAIL is setting up the first Hazira-Vijaypur-Jagdishpur (HVJ) interregional gas pipeline, which will soon be connected to the urban distribution networks (Read: Gaz naturel : la formation d’une grande industrie au 20e siècle).
Could India supplement its production with imports? As early as the 1960s, the purchase of Iranian gas was considered, but never materialized in the following decades because of the impossibility of crossing Pakistan for political reasons [27].
Despite these limitations, a gas market is being organized. As long as supply did not reach urban distribution networks, gas prices were set by a committee of experts, and then, from the mid-1970s, they were negotiated between public companies and user groups. Finally, in 1987, the government instituted an Administered Pricing Mechanism that allowed producers to sell at a price made up of their costs plus a rate of return on investment, a price that was subsidized for gas used in the northeastern states, which were considered to be underdeveloped[28].
7. A fast-growing electricity sector, but still dominated by coal-fired power
In addition to increasing access to petroleum products and, belatedly, natural gas, Indians are becoming familiar with electricity, whose growth in gross production (Table 13) has allowed consumption to increase from 6.4 TWh in 1950 to 190.4 TWh in 1990 (Table 12). Who are the users? From which sectors does the electricity produced come? How has the organization of the electricity industry evolved, from production to distribution?
7.1. Electricity is spreading throughout the economy and society
During the 1950s and 1960s, electricity only marginally reached the poor peasants, who continued to burn animal or vegetable waste and firewood, all of which were becoming increasingly scarce [29]. Its use is concentrated in industry and, to a lesser extent, in the services and domestic uses of a few privileged urban groups (Table 11).
Table 11. Evolution of electricity consumption. [Source: up to 1970/71, P.H. Henderson, India, op. cit, p. 73, then Energy Statistics, op. cit, p. 53]
| Total (TWh) | Industry (%) | Agriculture (%) | Domestic (%) | Services (%) | Railroad (%) | Other (%) | |
| 1960/61 | 16.9 | 73.7 | 4.9 | 8.8 | 5.0 | 2.7 | 4.9 |
| 1965/66 | 30.6 | 72.8 | 6.3 | 7.8 | 5.5 | 3.5 | 4.1 |
| 1970/71 | 48.5 | 67.6 | 10.3 | 8.7 | 6.0 | 3.2 | 4.2 |
| 1975/76 | 60.3 | 62.4 | 14.4 | 9.6 | 5.8 | 3.2 | 4.6 |
| 1980/81 | 82.8 | 58.0 | 17.5 | 11.1 | 4.9 | 3.3 | 5.1 |
| 1985/86 | 123.2 | 54.4 | 19.0 | 14.0 | 5.9 | 2.6 | 4.1 |
| 1990/91 | 190.4 | 44.2 | 26.4 | 16.8 | 5.9 | 2.2 | 4.5 |
The most important use of electricity by far is in industry. At the beginning of the 1970s, the 33 TWh it consumed annually were mainly for the production of aluminum (3.6), steel (3.2), cotton (3.1), fertilizer (2.8), chemicals (1.8), cement (1.4), paper (1.1) and machinery (1.0). Over the next 20 years, this growth continued, but at a slower rate than for other uses.
Of these, agriculture was the fastest growing, with a five-fold increase in its share of total consumption between 1960 and 1990 as a result of the electrification of the countryside, which made it possible to distribute electric pumps for crop drainage. From 21,000 pumps in 3,100 electrified villages in 1950/51, their number jumped to 2,440,000 in 156,000 villages in 1973-74, i.e. 27.5% of the 570,000 in India at that time. Geographically variable, electrification reached 100% in Haryana, 97% in Tamil Nadu, 85% in Kerala, and 55% in Punjab [30]. This strong growth was further reinforced by the creation in 1970 of the Rural Electricity Corporation (REC), which provided resources to the State Electricity Boards (SEBs). The number of electrified villages rose to 249,799 in 1980 and 470,838 in 1990.
The third rapidly growing use of electricity was for urban services (tramways, lighting, shops, government offices) and for high-income households, whose share, stable until the 1980’s, grew very rapidly thereafter with the development of distribution networks.
But where does this electricity come from? How is it produced?
7.2. Coal-fired power still dominates the generation mix
Until the early 1980s, electricity was generated from practically only two sources: hydroelectricity and coal-fired power (Table 12). The rest came from small diesel generators scattered throughout the country (there were already more than 400 in 1952) or from the few power plants burning fuel oil in Mumbai, Gujarat and Bihar. Since then, three new technologies have come into play: thermoelectricity-gas, nuclear power and, very marginally, solar photovoltaic and wind power. However, none of these technologies could dethrone thermal-coal, whose share increased from 60% in 1950 to 66% in 1990, despite supply difficulties such as those encountered with lignite from Tamil Nadu.
Table 12. Evolution of electricity production. [Source: Energy Statistics, op. cit. These data differ very slightly in some years from the BP Statistical Review.]
| TWh | Total | Hydro | Coal thermal | Hydrocarbon thermal | Nuclear | Other | Total Tcam (%) |
| 1950 | 7.1 | 2.5 | 4.3 | 0.3 | |||
| 1955 | 10.9 | 3.8 | 6.8 | 0.3 | 9.0 | ||
| 1960 | 20.1 | 7.8 | 11.9 | 0.4 | 13.0 | ||
| 1965 | 36.8 | 19.2 | 17.2 | 0.4 | 12.9 | ||
| 1970 | 61.2 | 30.4 | 29.1 | 0.4 | 1.3 | 10.7 | |
| 1975 | 85.9 | 39.7 | 43.6 | 0.5 | 2.1 | 7.0 | |
| 1980 | 119.3 | 55.4 | 60.5 | 1.0 | 2.4 | 6.7 | |
| 1985 | 186.4 | 51.8 | 116.0 | 13.7 | 4.5 | 9.3 | |
| 1990 | 287.8 | 66.4 | 191.6 | 23.3 | 6.4 | 0.2 | 9.1 |
This growth in gross production was based on the expansion of a generating fleet that reached 64 GW at the end of the period (Table 13).
Table 13. Evolution of the electricity generating fleet 1950-1990. [Source: Energy Statistics, op. cit. and Government of India. Ministry of Power. Growth of Electricity sector in India from 1947-2020. October 2020, 75 p.]
| MWe | Coal | Gas | Diesel | Nuclear | Hydro | Renewable | Total | Tcam % of total |
| 1947 | 756 | – | 98 | – | 508 | – | 1 362 | |
| 1950 | 1 104 | – | 149 | – | 560 | – | 1 713 | 7.9 |
| 1956 | 1 597 | – | 228 | – | 1 060 | – | 2 886 | 9.1 |
| 1961 | 2 436 | – | 300 | – | 1 917 | – | 4 653 | 8.6 |
| 1966 | 4 417 | 137 | 352 | – | 4 124 | – | 9 027 | 14.2 |
| 1974 | 8 652 | 165 | 241 | 640 | 6 966 | – | 16 664 | 6.2 |
| 1979 | 14 875 | 168 | 164 | 640 | 10 833 | – | 26 680 | 9.9 |
| 1985 | 26 311 | 542 | 177 | 1 095 | 14 460 | – | 42 585 | 8.1 |
| 1990 | 41 236 | 2 343 | 165 | 1 565 | 18 307 | – | 63 636 | 8.4 |
The hydraulic production capacities are already very important in 1950 (37% of the park) because the Indian hydraulic potential, between 6 and 13 GW, had started to be exploited at the end of the 19th century with the construction of large projects such as the 400 kW of Crompton in Darjeeling (West Bengal) as early as 1897, then the 15 MW of Cauvery Falls (Karnataka) and especially the 45 MW of the Tata Hydro-Electric Power Supply Co Ltd, installed on 300 million m3 (Mm3) reservoirs fed by the monsoon, in the Ghats, about 80 km from Bombay. Inaugurated in 1915, the Khopoli power station consisted of four Pelton turbines of 10.25 MW each, providing a current transported in 100,000 volts over 70 km to the already numerous factories of Bombay (Read: Energy in India, the genesis of its powerful coal industry). Subsequently, development continued at an average annual rate of 8.7%, although the difficult climatic and geological conditions of the sub-Himalayan regions (70% of total hydraulic capacity) increased the already heavy cost of the initial investment. Among the major projects started after 1950: Damodar (in West Bengal), Hirakud (Orissa), Bhakra and Nangal (in Punjab and Haryana), Kosi (Northern Bihar and Nepal) and Tungabhadra (Andhra Pradesh and Mysore) [31].
India was the first Asian country to embark on nuclear power production with the commissioning of its boiling water reactor at Tarapur in 1969 and its Canadian Candu in 1973, but because of the military dimension of its program, in a context of tension with Pakistan, it was unable to continue on its initial path [32]. Embargoed since the explosion of its first atomic bomb in the Thar Desert in 1974, it has never wanted to sign the Non-Proliferation Treaty (NPT), which theoretically prohibits all trade in nuclear material, whether civilian or military (Read: Non-prolifération des armes nucléaires). It has therefore favored a national technology capable of operating on the basis of thorium, of which it has vast reserves, at the cost of a much slower growth in its installed power than that of the other major Asian countries. This approach has not been abandoned, since in early November 2011 it will announce the construction of a new low-radioactivity thorium prototype.
In addition to the start-up of the nuclear fleet, gas-fired thermoelectric capacity has been available since 1980 off Mumbai and in Gujarat.
Until then, the Indian fleet was essentially developed on a thermoelectric-coal basis, which was the cheapest, quickest to implement and best mastered by Bhavat Electricals Ltd (BHEL), the main supplier of electrical equipment, despite the low efficiency of coal consumption (on average 680 gr/kWh, against 340 in Japan), due to the poor quality of the fuels and to a defective management of the power plants (load factor of 66% on average against 85-90% in industrially advanced countries, among others). In addition, but this applies to all electricity consumption, there is an abnormally high loss rate in the transmission and distribution networks (up to 23% in 1990), partly due to power theft.
7.3. Evolution of the organization of the electricity industry
The development of the Indian power system would not have been conceivable without an evolution of its institutions.
In the aftermath of the Second World War, production, transmission and distribution were still governed by the 1910 Act, inspired by the British Electrical Lighting Act of 1888, which gave full power to local authorities. In this context, multiple electrical companies were created. They range from large industrial groups such as the Tata Power Co in Bombay or the Calcutta Electric Supply Corporation (CESC) to small companies managing a mini-power station and a city or even neighborhood distribution network. Interconnections between all these companies are almost non-existent [33].
This organization of the electricity industry was not disrupted by the political independence of 1947, but was supplemented in 1948 by the Electricity Supply Act, which established the Central Electricity Authority (CEA) with the task of developing a nationwide public industry based on State Electricity Boards (SEBs), which were responsible for investments in each state. By 1990, India had 18 of the 25 states in the Union.
In the meantime, aware of the weaknesses caused by the fragmentation of the electricity system, most of these SEBs, which remained distributors at the state level, set up large public companies to produce and transport electricity:
– the National Thermal Power Corporation (NTPC), set up in 1975 to develop thermoelectricity,
– the National HydroElectric Power Corporation (NHPC), in charge of hydroelectricity, wind power and tidal power,
– the Power Grid Corporation, in charge of high-voltage power since 1989, as part of a transmission network that grew from 23,238 km in 1948 to 4,407,501 in 1990.
In addition to the production of these large public companies, which in 1990 represented more than 80% of the electricity produced in India, there is also the production of
– the large private companies, both producers and distributors: Tata Electric Company, Ahmedabad Electric Supply Company, Surat Electricity Supply Company, Bombay Suburban Supply Company, Calcutta Electric Supply Corporation;
– self-generators, in particular diesel generators, whose contribution will never exceed 10% of gross production.
A step forward
At the beginning of the 1990s, the state-run economy built since independence in 1947 was coming to an end. In a little over forty years, the energy bottleneck has been loosened. The 100 Mtoe of primary energy consumption in 1950 has been multiplied by almost four, of which 54% from modern sources instead of 20%. To achieve this, the coal industry was completely reorganized, a hydrocarbon industry, oil and natural gas, was set up, and an electricity industry was structured.
However, everything is far from perfect. In spite of a rapid rural electrification, the Indian countryside still relies on limited traditional sources of power, especially from an environmental perspective. From mid-1980 onwards, coal production no longer kept pace with consumption, oil production was still very inadequate, and electricity production was handicapped by a lack of capacity adapted to needs, as well as by a lack of means of transport and distribution. This is reflected in the power cuts that regularly paralyze most Indian cities.
Among the many causes of these deficiencies, the finger is increasingly being pointed at the state ownership of the energy system. It needs to be liberalized, it is said, from various quarters. The appointment of P.V. Narasimha Rao as Prime Minister and Manmohan Singh as Finance Minister meets this expectation (see: Energy in India, liberalization in the 2000s and its consequences, in preparation).
Notes & references
[1] The estimate is in 1990 Geary-Kharmis international dollars. Maddison Angus (2001). The World Economy. A Millennial Perspective. Paris: OECD, 400 pp. (p. 322).
[2] Sukhamoy Chakravarty (1934-1990), who was, together with P.C. Mahalanobis, one of the main actors of Indian planning, evokes very well the genesis of Nehru’s economic ideas, a modernizer par excellence, in the first of the articles collected by Ignacy Sachs, in Chakravarty Sukhamoy. (1987). Planning economic development. The Indian experience. Paris: Editions de la Maison des Sciences de l’Homme, 151 p.
[3] Jaffrelot Christophe (1996). L’Inde contemporaine de 1950 à nos jours. Paris : Fayard, 742 p (pp. 86-87).
[4] Boillot Jean-Jacques (1985). Industrialization and opening up of India 1950-1985. Full text CEPII, pp. 61-94, in Google
[5] The overlapping of years is explained by the fact that the Indian calendar year begins on April1. The first plan starts on April1, 1951 and ends on March 31, 1956, and so on.
[6] Was there any other solution to ease the bottleneck of coal supply? Gilbert Etienne thinks so, judging that it was “by demagogy” that Indira Gandhi nationalized the coal mines and banks. Etienne Gilbert (2007). China-India, the great competition. Paris : Dunod, 224 p. (p. 56).
[7] Etienne Gilbert (2007). China-India, op. cit, p. 11.
[8] Judge Ahluwalia Isher (1985). Industrial growth in India. Oxford University Press, 234 p (p. 77).
[9] The statistical data on the coal industry are taken from Etemad Bouda and Jean Luciani (1991). World Energy Production, Geneva, Librairie Droz, 272. They were supplemented after 1985 by data from the International Energy Agency’s Coal Information. These data are identical to those published by the Indian Ministry of Coal, except for the volumes of coking coal, which were always 10 Mt/year higher from 1985 onwards.
[10] Except for one of them, the Central Mine Planning and Design Institute Limited, which serves the other seven.
[11] Due to a lack of information, it is difficult to deal with illegal mines, operated by small farmers in areas where outcrops make this possible. It seems that these mines have never been as important in India as in China, but they cannot be ignored. Lahiri-Dutt K. Informal coal mining in Eastern India: Evidence from the Ranaiganj Coalbelt. Natural Resources Forum, February 2003, vol. 27, no. 1, pp. 68-77.
[12] Henderson P.D (1975). India: The Energy Sector. A World Bank Publication by the Oxford University Press, 190 p, (p. 100).
[13] Henderson P.D. India, op. cit, p. 101.
[14] A detailed description of the production techniques used by each company is given by Coal Industry Advisory Board (CIAB). Coal in the Energy Supply of India. Paris: OECD, 2002, 115 p.
[15] “Longwall applications have been beleaguered by a wide array of problems including design shortfalls with inappropriate selection of sites with geological surprises, inappropriate selection of equipment, lack of outbye clearance, and the overall efforts have been bedevilled also by a lack of mechanisation culture” according to Professor A.K. Ghose of the Indian School of Mines. Inside Brief, op. cit, p. 2.
[16] Bettelheim Charles (1962). Independent India. Paris: Armand Colin, 522 p, (pp. 324-325).
[17] Inside Brief: India. International Coal Report, 11th November 1994. This article lists the coking washing facilities between 1958 (Kargali) and 1989 (Mohuda).
[18] A map of the main industrial locations in 1947 can be found in Tomlinson B.R. India, op. cit, p. 96. The steel industry remained concentrated near the coal mines on the sites of Asansol and Jamshedpur. Cement factories were spread throughout the country.
[19] What Isher Judge Ahluwalia does. Industrial Growth in India. Stagnation since the mid-sixties. Delhi: Oxford University Press, 1985, 235 p (pp. 76-87).
[20] In Headrick Daniel R. (1988). The Tentacles of progress. Oxford University Press, 406 p (pp. 58-68), the detailed history of the origins of this aberration.
[21] Etienne Gilbert. China-India, op. cit, p. 140.
[22] And probably also of the decline in its use as a fuel until the mid-1970s, when its taxation was brought into line with that of diesel. P.D. Henderson, India, op. cit, p. 53.
[23] Bettelheim, Charles. India, op. cit, pp. 322-324.
[24] As early as 1959, India was spending more than 25 per cent of its export earnings on petroleum and petroleum products or equipment for the oil industry. In the absence of a rapid expansion of crude oil production, Minister Malaviya predicted that by the end of the Third Five-Year Plan, India would have to spend 60 per cent of its export earnings on crude oil. Charles Bettelheim. India, op. cit, p. 324. This situation obviously worsened with the oil shocks of 1973 and 1979.
[25] Azhar Muhammad (2007). Natural gas in India’s energy management. OPEC Review, vol XXXI, 1, pp. 53-72.
[26] Henderson P.D (1975). India, op. cit.
[27] Verma Shiv Kumar (2007). Energy geopolitics and Iran-Pakistan-India gas pipeline. Energy Policy, vol. 37, issue 6, June, 3281-3301.
[28] Jain Anil and Sen Anupama (2011). Natural gas in India: an analysis of policy. The Oxford Institute for Energy Study, Apri, 45 pp.
[29] Lucas Nigel J.D. India: some aspects of energy policy (pp. 203-220). International Energy, 1988-1989. Paris: Economica, 1988, 422 p. Pachauri R.K. India’s Energy Challenge. Public Policy Research, September-December 2006, pp. 200-205.
[30] Henderson P.D. India, op. cit, p. 74.
[31] Lanthier Pierre. The four phases of the history of electricity in India from 1890 to the present. https://www.peterlang.com/view/9782807600287/chapter26.xhtml
[32] This interest in nuclear power goes back to the establishment of the Atomic Energy Commission in 1948, followed by the first research reactors, including Apsara in 1957.
[33] Lanthier Pierre. The four phases, op. cit.