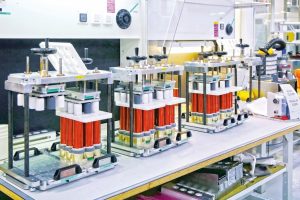
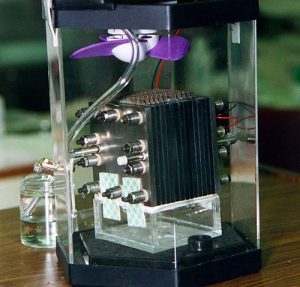
To shed light on the competition between the automotive technologies of the future, a systemic model must be developed. It compares the benefits of each solution for the user, the automotive industry, and public policy.
This article was originally published in French in the Encyclopedia of Energy on October 16th 2019, under the : L’automobile du futur : les technologies énergétiques en compétition.
The automotive industry is looking for disruptive innovations that could contribute to its survival and, if necessary, provide it with sustainable competitive advantages (Read: L’automobile du futur : quelles sources d’énergie ?). But innovation is a complex process. It has been identified as a critical factor in business development, but it remains very difficult to manage when it emerges or must be integrated into long-established organizations[1]. Understanding the directions it is likely to take requires the use of an analytical model.
1. An analysis model
Many factors or combinations of factors have been put forward by economic and management researchers to explain the variables that can lead to the success or failure of technical and organizational innovations[2]: organizational configuration, including organizational size, cultural context, strategy and leadership, and human resource creativity. Nevertheless, the understanding of best practices for innovation remains very imperfect[3] and innovation is a fragile and vulnerable process[4]. According to Dougherty and Hardy, large organizations seem unable to innovate in a sustainable way over the long term.
But the main weakness of the academic literature remains its inability to provide decision-makers with an operational model for innovation management. In general, the models that have been published favour a vision of supply by research institutions and companies and neglect a vision based on demand, and in particular the expectations of users and/or consumers and their level of acceptance of the technical innovations proposed to them.
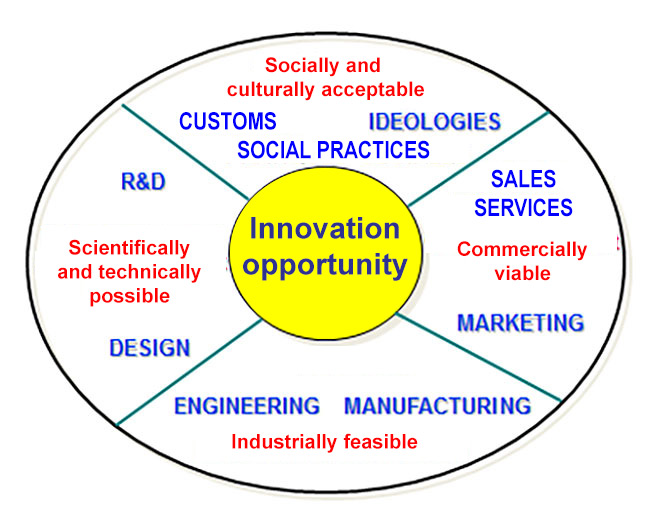
A new analysis grid makes it possible to assess the potential for the emergence of new products, services, processes or organizations (Image 1)[5]. It implies that four conditions must be met simultaneously (same time, even same place). Any potential innovation must be:
- “Scientifically and technically possible”, i.e. meets the technical performance expected from consumers and users
- “Industrially feasible”, i.e. produced at costs and quality levels that satisfy all stakeholders
- “Commercially viable”, i.e. launched at a selling price and with maintenance costs that are acceptable to the market
- “Politically, socially and culturally acceptable”, i.e. has political support and full consumer acceptance
The grid proposes that the success of a given innovation is only possible when and if the main variables associated with these four conditions are favourable and that failure occurs when key aspects of one or more conditions are not met.
The following is based on a qualitative research methodology. Information, data and opinions were collected through a review of the theoretical literature and specialized scientific and technical literature: information from traditional automotive stakeholders (manufacturers, equipment manufacturers, university laboratories, component manufacturers), as well as potential new players (energy suppliers, battery and fuel cell manufacturers, hydrogen producers and distributors). This literature review made it possible to put together an interview guide which, after having been tested with a limited number of interviewees, was then conducted with managers of car manufacturers and equipment manufacturers in charge of research and development and/or planning and with researchers from the main public laboratories conducting innovative automotive projects in charge of advanced components such as batteries, electronic control units and fuel cells. Managers of energy supply companies (electricity, biofuels, hydrogen) were also interviewed. All interviewees held decision-making positions in their respective functions: R&D, strategy, new product development, production planning. More than seventy interviews were conducted in China, France, Japan, Germany, Italy and the United States on several occasions between 2010 and 2014.
Only technical, economic, social, cultural and political factors that influence the characteristics of technological innovation in the automotive powertrain were considered. Clearly, a more scientifically robust exercise should take into account technological trends for other on-board equipment; changes in consumer behaviour, such as mobility choices; new forms of transport organisation (passenger and freight); and changes in administrative regulations and governance.
2. Competing options
Applied to the various technological options (Read: L’automobile du futur, quelles sources d’énergie ?) the innovation model provides key elements for technology assessment and scenario construction.
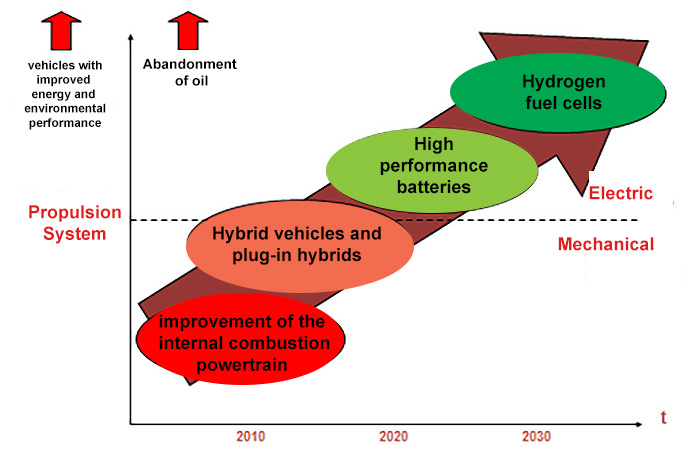
There is a consensus among the interviewees on a general scenario in which the different paradigms would appear successively over time, i.e. as soon as each is possible, feasible, acceptable and commercially viable (Image 2).
As the prerequisites for minimum vehicle performance (habitability and speed), safety and reliability have been fully met, the six main key success factors from the literature review and interviews are as follows:
- Autonomy
- Technological simplicity
- Total cost, i.e. purchase and operating cost
- Availability and security of supply, in time and space, of primary energy
- Safety and reliability
- Time scale for the deployment of innovations
For the automobile, the storage of primary energy in the vehicle is one of the essential factors in decision-making by customer-users because it determines five fundamental variables: range, replenishment time, safety, vehicle weight and size and total cost (Table 1).
The autonomy or distance covered between two replenishments is obviously a key point. There is no consensus on a minimum acceptable level for a conventional vehicle used in urban areas and for interurban connections. If the vehicle of the future is a small city car, a relatively limited range may be possible. We know that in France, for example, in 2008, 65% of trips were made by car, both as passengers and drivers, for 83% of the distance travelled, with an occupancy rate of 1.4 people per car. 73% of “commuters” use a car or motorcycle[6]. 99% of trips and 60% of distance travelled consist of “local” mobility, i.e. remain within an 80 km radius of the home. There are 3.15 daily trips for a total distance of 25.2 km and 8 km per trip. In Europe, only 13% of trips are more than 60 km long and nearly 40-50% of cars never travel more than 150 km in a single trip. There are obviously significant differences between urbanised areas and large cities and rural areas where cars are almost ubiquitous due to a lack of alternative options.
Table 1 : Compare energy storage
| Unit | Gasoline | Diesel | Electricity | Natural Gas | Liquified Gas | Compressed H² | Liquid H² | |
| State | Liquid | Liquid | Chemical | Gas | Liquid | Gas | Liquid | |
| Temperature | Centigrade | Ambient | Ambient | Ambient-300° | Ambient | Ambient | Ambient | -253° |
| Pressure | Bars | 1 | 1 | 1 | >200 | 5-25 | 350-700 | 5 |
| Mass energy | Wh/kg | 11900 | 11800 | 30-200 | 2200 | 7080 | 1200 | 500-1000 |
| Volumetric energy | Wh/l | 8900 | 9900 | 70-300 | 2500 | 4300 | 450 | 1800 |
| Recharge time | Minutes | 5 | 5 | 30-360 | 5 | 5 | 5 | 5 |
| Wheel tank efficiency | % | 30-35 | 40-42 | 80-85 | 20-38 | 30-35 | ~50 | ~30-35 |
| Weight for 60 litres | Kg | 45 | 50 | 90-150 | 70 | 36 | 90-100 | 100-200 |
| Autonomy | Km | ~900 | ~1000 | 30-120 | 160 | 430 | 200-300 | ~180 |
| Sources: Syrota, 2008 and press clippings. | ||||||||
The majority of trips are local in nature, depending on spatial interaction criteria closely linked to the organization of space and the location of places of employment, shops and facilities in relation to places of residence. This means that the electric car with a reduced range, less than 100-150 km per charge, could, in theory, satisfy almost all the daily needs of consumers. Obviously, the need for long-distance interurban travel, which concerns a small percentage of customers, would still have to be resolved. One solution often put forward is multi-motorization: a small urban car and a “large” family car per household. But, for the time being, customer preference is for a “universal” vehicle rather than for several specialized vehicles per household. One of the key characteristics of the automotive market is that any alternative product will inevitably be calibrated to the performance of the current dominant design.
Time scale is another crucial dimension. Customers are never ready to switch from one technology to another in just a few years. There are about 1.2 billion vehicles on the road in 2014, 72% of which are passenger cars. In 2013, new annual registrations, which renew the fleet, are in the order of 81 million vehicles, including 60 million passenger cars, and analysts predict 85 million vehicles in 2015 and 105 million in 2020, including 78 million cars.
According to industry experts, fleet renewal should take at least 15 years[7]. But these estimates are based on a supposition of unchanged technology. A new technology should follow the same path as the cycle for any new product, namely an S-curve with a relatively slow take-off to large volumes, which will probably take several decades.
The total cost will inevitably be a decisive criterion. The cost of energy is the highest. If the price of oil exceeds US$200 per barrel for a long time and then continues to rise, as many experts predict, it creates a strong incentive for research and then for the massive diffusion of an alternative powertrain. But given the current state of technology and the price of gasoline in 2014, which looks like it will remain stable or even decline with the emergence of shale gas, all alternative solutions will prove to be more expensive. Plug-in hybrids or all-electric battery-powered solutions will face a charging cost that could increase with the development of a dedicated infrastructure of charging stations and terminals and the deployment of national electricity grids that will need to be dramatically upgraded to support the rapid and simultaneous charging of millions of vehicles. The cost of replacing batteries at the end of their life could also be high.
In 2008, Williams estimated that rechargeable HEVs (hybrid electric vehicles) could be a viable solution if gasoline was priced at more than US$6 per gallon in the United States[8]. At its highest in 2008, it was US$4 and it is just over US$3 in 2014. Many authors have recently examined the different comparative advantages of battery-powered vehicles and conventional vehicles in terms of fuel consumption, pollution, life cycle, and total cost, but it has proven impossible to determine a clear loser or winner, as the underlying assumptions for such studies are too numerous, complex and variable[9].
Technological simplicity is a more difficult factor because it is strongly linked to socio-psychological determinants. According to surveys conducted in Europe and the United States, customers seem to have a preference for a single technology when deciding on a car powertrain. This criterion is obviously associated with that of technical reliability, which determines the durability and cost of maintenance and repair, and the security of both driving and supply. The presence of a robust network of petroleum fuel service stations gives them a strong advantage in these areas. Electrical alternatives must ensure comparable performance.
In behavioural terms, the first feedback from Renault Zoe and Twizy owners would tend to show a satisfaction rate, due to the absence of noise and ease of driving, at much higher levels, 98%, than those recorded in the past for new innovative models. And the vast majority say they would never return to internal combustion technology!
While the environmental performance of a given powertrain is not yet a real decision-making criterion, most industry experts believe that environmental sentiments should become more important in the future. In any case, it is necessary to differentiate the performance of the vehicle not only at the time of use, or instantaneous performance, from that of the well-to-wheel (WTW) impact. And in this respect, partially or fully electric solutions must be evaluated in complete transparency. Indeed, everything depends on the energy mix of electricity production. In some countries, such as China, the United States, and Germany, which still use coal extensively, plug-in hybrids and battery-powered vehicles have higher CO2 emissions than conventional vehicles.
In countries where the share of nuclear energy is high, electric and plug-in hybrid vehicles are obviously efficient. But it should be stressed that the shift of a significant proportion of the vehicle fleet to all-electric battery-powered vehicles raises the problem of the capacity of electricity networks, not only in terms of voltage and therefore in terms of the cross-section of low-voltage lines, but also, and one could say above all, in terms of production capacity. For example, it is estimated that a fleet of 3 million electric vehicles requires an additional Evolutionary Pressurized Reactor (EPR) and 6 to 7 EPRs for the electrification of the entire fleet. Difficulties in relation to the increase in use of nuclear energy, such as the cost and time required to build such equipment, constitute a serious obstacle to such a scenario.
3. The automotive industry
What lessons can be learned from a complete scan of the technical documentation and about 100 in-depth interviews with executives in charge of product strategy and R&D at automakers (Toyota, GM, Chrysler, Nissan, Renault, Peugeot-Citroën, Daimler-Benz, BMW, Fiat, Hyundai, Kia), major public and private research laboratories, specialised non-profit professional organisations, transport companies and public administrations on the environment, manufacturers of innovative components (batteries, fuel cells, electronic control units) in China, Japan, Europe and the United States?
The research is qualitative, investigating a common phenomenon in a real-life context in order to preserve the holistic and significant characteristics of real-life events[10]. Considered as part of an analysis of technology and innovation, it is the expression of a set of opinions and is obviously not scientifically adapted to generalization, because it is not based on a recognized technology forecasting method such as Delphi, scenario development or probabilistic forecasts[11].
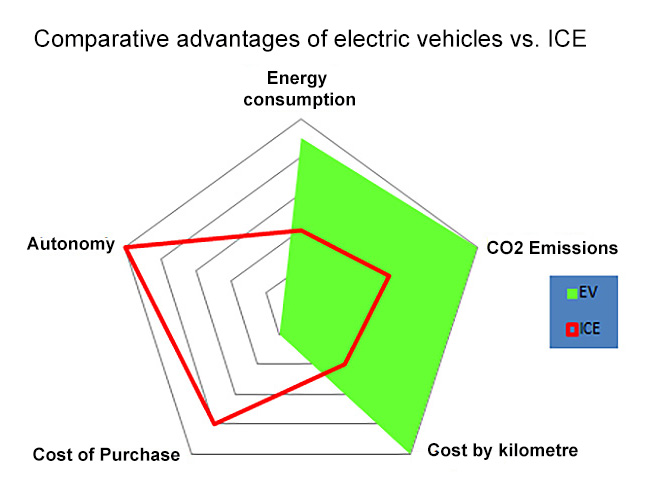
A first conclusion is the broad consensus among respondents that competition between the all-electric vehicle and the dominant design of the internal combustion engine (ICE) is still far from being played out on the following five factors: energy consumption, range, CO2 emissions, purchase price and operating costs (Image 3).
Technical but also behavioural factors may lead to the electric car moving towards a more acceptable range. Political factors such as subsidies and increased production volumes can help to move the purchase price in the right direction. But other factors can give the conventional engine a new lease on life in terms of running costs: a lower price and guaranteed availability of petroleum products or significant progress in terms of pollution control and energy consumption.
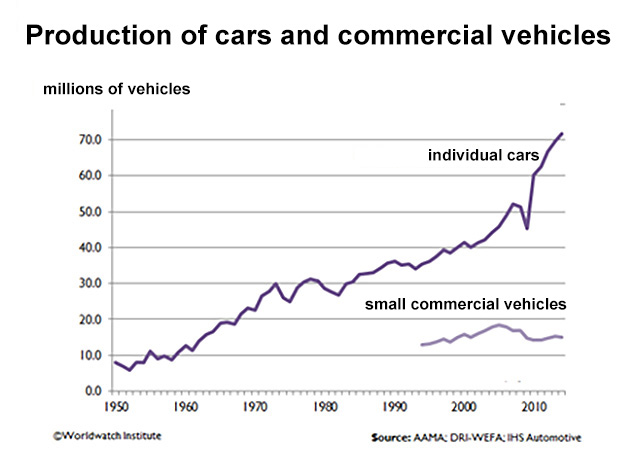
Forty years after a first research study on automotive innovation conducted in 1972-1973, caution and moderate optimism are in order[12]. The resilience of this industry is remarkable. Global demand is growing, driven by fleet renewal but also by new car ownership in emerging countries (Figure 4). A long term analysis demonstrates that there are no signs of significant, long-lasting reversals in this trend. And the motorization needs of developing countries are enormous.
The automotive industry, in its current configuration, is a complex system that involves many activities, all of which are interdependent, although they may sometimes have conflicting interests: assembly, components and equipment, trade and repair, bodywork-trailers and caravans, fuel production and distribution, road construction and maintenance, public administrations, road transport, insurance and financing, sports and the press, among others[13]. In France, about 10% of the working population is directly or indirectly dependent on the system!
It is a mature industry with perfectly mastered technologies that can still be improved in terms of energy consumption and pollution, and with knowledge and know-how that are difficult to acquire without going through the major traditional players. The industry also consists of gigantic and, for the moment, unavoidable fixed industrial investments, managed by emblematic industrial groups, few in number and unwilling to let “entrants” thwart their acquired positions, already battered by their own competition. Finally, these companies are totally “path dependent” on the dominant technology, and in general they do not master alternative technologies that are not derived from the metal-mechanical technical system that has been the source of their fortune[14]. In such a context, it is not surprising to observe that technology takes many years to evolve, not only because of its complexity but also because of the resistance of the relevant actors.
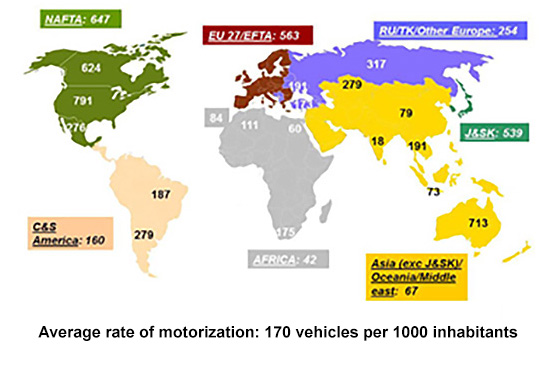
Finally, the automobile industry is a powerful economic policy tool not only in manufacturing countries such as China, the United States, Japan, Germany, Italy, South Korea, Brazil and others, through direct and indirect employment, but generally in all countries with increasing motorization through tax revenues related to the acquisition and use of vehicles (Image 5). The lobbies game is edifying in this respect: Germany, the country where ecological sentiment is strongest, but also where the automobile industry is flourishing (Volkswagen, BMW, Daimler-Benz), is one of the few countries to have no tax incentive system for clean cars. The German government is probably waiting for the green light from its national car manufacturers so that French and Japanese competitors do not increase their market share and appear to be more innovative and more environmentally friendly!
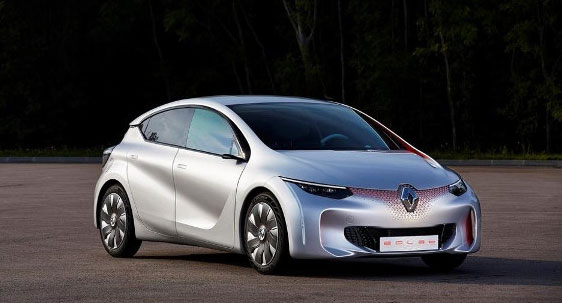
Is the low-energy hybrid technology solution that is making the heyday of the 2014 Paris Motor Show with 1.3 to 2 litres per 100 km capable of delaying the emergence of the electric car by a few decades and thus giving time for a hydrogen solution to emerge (Image 6)?
Notes and references
[1] Schumpeter, J.A., (1911), The Theory of Economic Development: An Inquiry Into Profits, Capital, Credit, Interest, and the Business Cycle, Harvard University Press, Cambridge, 1934 edition. Chanaron, J.J., Metcalfe, S.M., (2007), Schumpeter’s Innovation Theory, in Carayannis, E., Ziemnowicz C., (2007). Re-Discovering Schumpeter: Creative Destruction Evolving into’Mode 3′, MacMillan-Palgrave, New York, pp. 52-67.
[2] Hundreds of researchers have published literature reviews on economics and innovation management in the last twenty years, including Tidd, Bessant and Pavitt (1997); Chanaron (1998); Burgelman, Christensen and Wheelwright (2004); Carayannis & Ziemnowicz (2007).
[3] Ahmed P. K., (1998), Benchmarking innovation best practice, Benchmarking for Quality Management & Technology, 5, 1; pp. 45-56.
[4] Dougherty D., Hardy C. (1996). Sustained product innovation in large mature organizations: Overcoming innovation-to-organization problems, Academy of Management Journal, 39, 5, pp. 1120-1153.
[5] Chanaron J.J., (2013), Innovation Valuation: Guesswork or Formalized Framework? A Literature Review, in AKHILESH, K.B., (2013), Emerging Dimensions of Technology Management, Springer India, pp. 17-33. Chanaron J.J., (2014), Towards an Operational Framework in Forecasting Breakthrough Innovation: The Case of the Clean Automobile, International Journal of Electric and Hybrid Vehicle, Vol. 6, N°2, pp. 1-24.
[6] Last major INSEE transport survey available.
[7] Heywood J., & al., (2008), On the Road in 2035, MIT, July. Syrota J., (2008), Perspectives concernant le véhicule “grand public” d’ici 2030, Centre d’Analyse Stratégique, Le Point, Paris, 28 September.
[8] Williams E., (2008), Plug-in and Regular Hybrids: A National and Regional Comparison of Costs and CO2 Emissions, Climate Change Policy Partnership, Duke University, November.
[9] Aguire B., Eisenhardt L., Lim C., Nelson B., Norring A., Slowik P., Tu N., (2012). Lifecycle Analysis Comparison of a Battery Electric Vehicle and a Conventional Gasoline Vehicle, California Air Resources Board, June. Cai Z., Ou X., Zhang Q., Zhang X., (2012), Full lifetime cost analysis of battery, plug-in hybrid and FCEVs in China in the near future, Frontiers in Energy, 6, 2, pp. 107-111. McCullough R. (2012). Are Electric Vehicles Actually Cost-Effective, Electricity Policy.com, pp. 1-10. Alexander M., Davis M., (2013), Total Cost of Ownership Model for Current Plug-In Electric Vehicles, EPRI Technical Report. Jun M., Di Muro (2013). Holistic Methodology to Analyze EV Business Models, International Journal of Innovation, Management and Technology, 4, 2, pp. 259-264.
[10] Yin (2009). Case study research: Design and methods (3rd ed.). Beverly Hills, CA: Sage Publishing.
[11] Jantsch E., (1967), Technological Forecasting in Perspective,. – La prévision technologique, Paris, OECD-OCDE, downloaded from https://www.echosdunet.net/dossier/diact
[12] Chanaron J.J. (1973), L’innovation dans la construction automobile, Thèse de doctorat, IPEPS/IREP, Grenoble, November.
[13] de Banville E., Chanaron J.J., (1985), Le système automobile français : de la sous-traitance au partenariat? Elements for a problem, CPE Etude, n° 56, May.
[14] Chanaron J.J., Bye P., (1995), Technology Trajectories and Strategies, International Journal of Technology Management, 10, 1, pp. 45-66.
L’Encyclopédie de l’Énergie est publiée par l’Association des Encyclopédies de l’Environnement et de l’Énergie (www.a3e.fr), contractuellement liée à l’université Grenoble Alpes et à Grenoble INP, et parrainée par l’Académie des sciences.
Pour citer cet article, merci de mentionner le nom de l’auteur, le titre de l’article et son URL sur le site de l’Encyclopédie de l’Énergie.
Les articles de l’Encyclopédie de l’Énergie sont mis à disposition selon les termes de la licence Creative Commons Attribution – Pas d’Utilisation Commerciale – Pas de Modification 4.0 International.
Translated with www.DeepL.com/Translator (free version).


