
Water supply: a challenge that water desalination is already helping to meet. In the continuation of an ancient history, the distillation process reveals its limits. Hence the great interest of reverse osmosis. A number of questions remain: what are the associated energy consumptions? What are the environmental impacts? The state of the market and the costs?
In the space of a few decades, access to water has become one of the challenges that humanity must rapidly overcome. Yet water is abundant on a global scale: the oceans are an inexhaustible reserve provided that salt and water are separated. Other reserves, such as brackish water that is too salty to be directly consumable, can also be exploited. This article details the different techniques already used for water desalination and those that are still at the research stage. The economic aspects, which condition the accessibility of these techniques, are also presented, as well as the energy and environmental dimensions of the issue.
&bsp;
1. A possible response to a growing need
According to the World Health Organization, nearly 700 million people, i.e. one person in ten, still do not have access to drinking water in 2015 [1]. More worryingly, a 2006 United Nations report estimated that 60% of the world’s population will face water problems by 2025 [2]. This means that the majority of humanity will not have access to sufficient quality water.
If the World Health Organization [3] estimates that the vital threshold is five liters per day per person, the situation starts to be critical below 100 liters per day to satisfy domestic needs and some collective needs. By the standards of developed countries, domestic consumption is around 200 litres per day per person (but 350 litres in the United States!) and between one and three cubic metres per day if we add collective uses, including agriculture.
And, for several reasons [4], the situation is getting worse. The world’s population is growing faster than the available water resources [5], the standard of living in emerging countries is rising and, generally speaking, water quality is tending to deteriorate. While it is obvious that the particularly dry tropical regions are very vulnerable, many countries outside these regions are already affected: Australia, the United States, countries in the northern Mediterranean basin, India, China, etc.
Yet water is abundant on earth: 70% of the world’s surface is covered by a reserve of 1.4 billion cubic kilometres of water… salt water. Taken together, this water would represent a cube of more than 1,000 kilometres on a side (Figure 1). But only 0.6% of the water on the surface of the globe is directly usable and fresh. The rest is contained in the oceans but also trapped in the form of ice, as water vapour in the atmosphere or simply remains inaccessible [6]. Furthermore, 36% of the world’s population lives within 100 kilometres of a coastline, 11% within 10 kilometres and 6% within 5 kilometres [7]. Desalinating seawater – or less salty but unsafe brackish water – to obtain fresh water is an attractive solution.
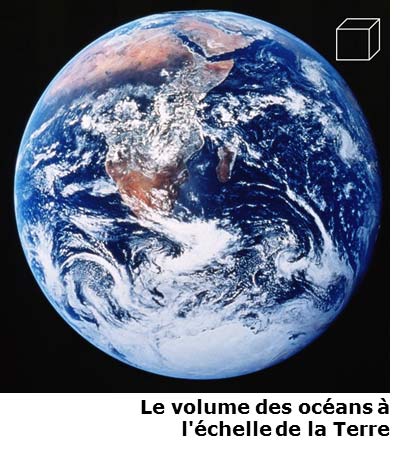
Fig. 1: The volume of the oceans at the scale of the earth [Source: NASA, 1972]
2. An old story
The idea of extracting drinking water from the sea is not new. Nature has always done this through the natural water cycle. Under the effect of the sun, the oceans evaporate, the water vapour forms clouds which cause rain or snow precipitation as soon as the humid air masses reach colder regions. The water in the precipitation is pure because the salt in the sea is not volatile and only the water evaporates.
Ancient sailors faced with the problem of providing water on board ship had already imitated nature by boiling sea water to extract unsalted water by condensing the steam produced (Figure 2). In Meteorologica, Aristotle (384-322 B.C.) wrote: ” I have proved experimentally that salt water that evaporates softens and that the condensed steam does not reform into sea water. Pliny the Elder (23-79, Natural History), Alexander of Aphrodite (150-215) and St. Basil (329-379, Homilies) seem to have been the first to describe processes for making sea water drinkable [8].

Fig. 2. Seawater boiled to extract unsalted water by condensation of the steam produced [Source : Meteorologica]
But it was not until the 18th century that processes to increase production, improve water purity or save energy were mentioned. And it was not until the beginning of the 20th century that the first truly industrial distillation processes appeared, i.e. the concentration of solutions and the production of fresh water by vaporisation and then condensation.Then, around 1959, a process called reverse osmosis was developed at the University of California[9] as an extension of the older method of separating the salts contained in molasses (Dubrunfaut, 1853[10]) and the colloids (Graham 1854, the origin of the term osmosis[11]). It is a membrane process: fresh water is extracted from salt water through a semi-porous membrane by applying pressure. The first commercial membranes date from 1970.Distillation processes and membrane processes are the two main families of processes used today on an industrial scale for seawater desalination. Other methods could emerge, but they are still at the laboratory stage or under development, and there is no guarantee that they will be competitive with the processes already well established.
3. How do you make fresh water from salt water?
Desalination of water concerns of course sea water but also brackish water. They differ in their concentration of dissolved salts and in their composition. For the oceans, sea water contains an average of 35 grams of salts per litre, 86% of which are sodium chloride and 13% magnesium and calcium carbonate and sulphate. In a much smaller proportion, 1% in total, we find almost all the periodic classification of elements! But the salinity of the seas varies greatly: seven grams per litre for the Baltic Sea and up to 270 grams per litre for the Dead Sea.
Apart from sodium chloride, brackish waters have a very diverse composition. The total concentration is much lower than in most seas, with salinity generally below ten grams per litre.
To produce freshwater from saltwater, the raw water must be introduced into a system to which energy is supplied (Figure 3). It is much easier and more efficient to extract the water rather than the salt, as only a little or a lot of water can be removed, whereas all the salt would have to be removed to obtain even a drop of fresh water. In practice, to avoid having to deal with the 35 kilograms of salt contained in each cubic metre of treated seawater, not all the fresh water is extracted: instead, the seawater is concentrated by a factor of about two. Thus, for each cubic metre of seawater treated – that is, 1000 litres – 500 litres of pure water will be produced and 500 litres of very salty water (containing 70 grams per litre of salt) will be discharged as brine.
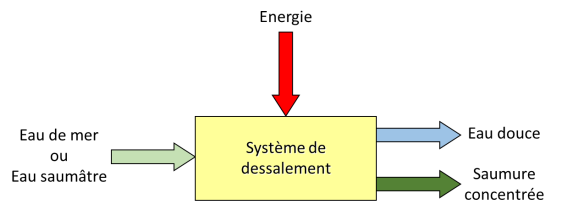
Fig. 3 : Principle of a desalination system [Source : Philippe Bandelier]
3.1. Distillation processes and their limitations
Of course, nothing seems easier than imitating nature. It is enough to distil sea water to extract fresh water, i.e. to produce steam by boiling the sea water and to recover the fresh water by condensing the steam. It should be noted that due to the presence of salt, salt water boils at a slightly higher temperature than pure water. The difference in boiling temperature between salt water and fresh water at a given pressure is called the boiling range.
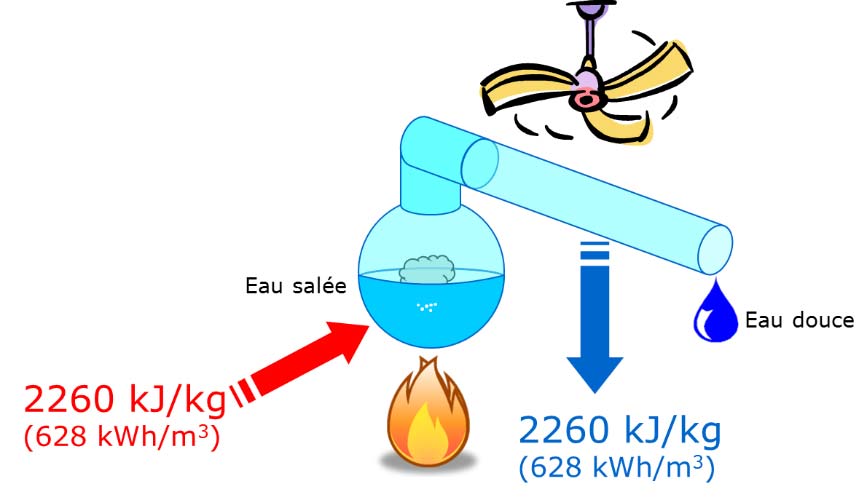
Fig. 4. Distillation processes [Source : author]
3.2. The revolution of the reverse osmosis membrane process
Reverse osmosis (Figure 5), industrialised from the 1970s onwards, was to revolutionise desalination. Once again, it was nature that inspired the engineers.
Osmosis is a natural exchange mechanism present in all living organisms at the cell level. Under the effect of a concentration difference, molecules diffuse from the most concentrated regions to the least concentrated, even through thin membranes, such as those of cells, if their physico-chemical nature allows it. If this is not the case, it is the water that will migrate through the membrane to dilute the concentrated area and balance the concentrations. At equilibrium, the pressure difference is called osmotic pressure.
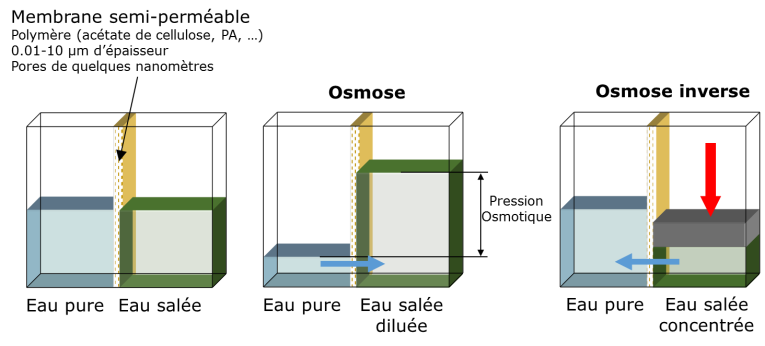
Fig. 5. Osmosis and reverse osmosis [Source : author]
3.3. Types of industrial processes used
The main industrial processes currently used are developments of the methods presented above; they fall into two categories: distillation processes and membrane processes.
Depending on the nature of the process used, the production capacity can vary from a few litres per day to several hundred thousand cubic metres per day. The choice of the process used depends on many parameters, but first and foremost on the nature of the water to be treated – seawater or brackish water, the desired production capacity, and the available energy source, as shown in Figure 6.
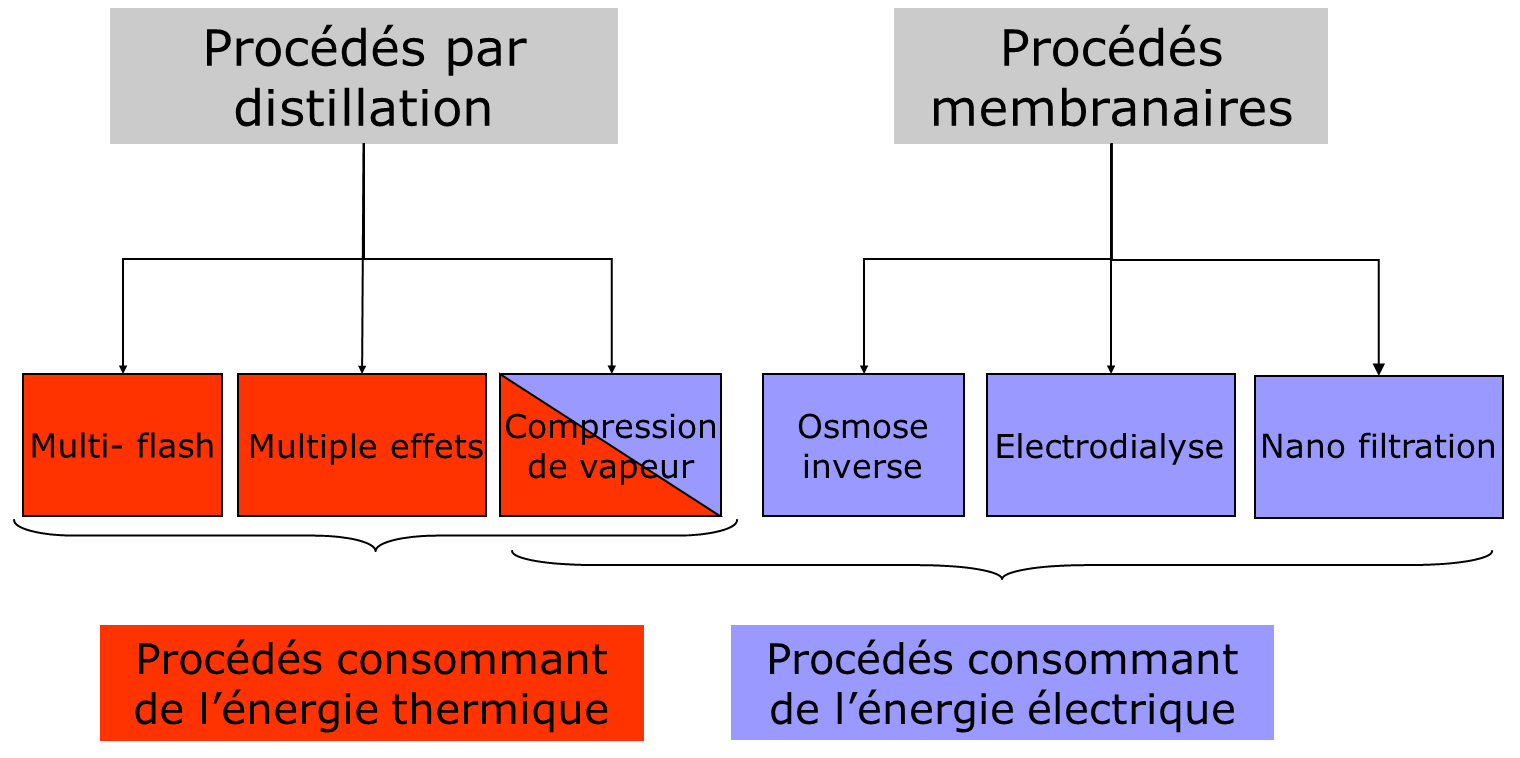
Fig. 6: Main industrial processes for seawater desalination [Source : author]
To these two main families, we can add non-conventional processes that are not widely used or are being developed, such as crystallization, air cycles (air humidification-dehumidification), membrane distillation, direct osmosis and many others.
4. Minimum energy for desalination
It is well understood that energy consumption is a key point in water desalination. We can then ask ourselves whether there is a minimum energy consumption below which it is impossible to go, even with an ideal system, without losses or irreversibility, with a yield equal to one hundred percent.
The minimum energy to be spent corresponds to the energy that compensates for the ebullioscopic difference for distillation and the energy that overcomes the osmotic pressure for reverse osmosis.
Simple calculations give a very good estimate of this minimum energy. In the international system, it is expressed in Joules per kilogram of fresh water produced, but more commonly in kilowatt-hours per cubic metre of fresh water (kWh/m3).
Thus, for distillation, since saltwater boils at a slightly higher temperature than pure water (Figure 7), if we consider seawater and pure water at the same temperature of 25°C, there will be less water vapour above the seawater than above the pure water. In other words, the partial pressure of water vapour will be lower over seawater. To obtain the same pressure, the seawater would have to be slightly warmer than the pure water.
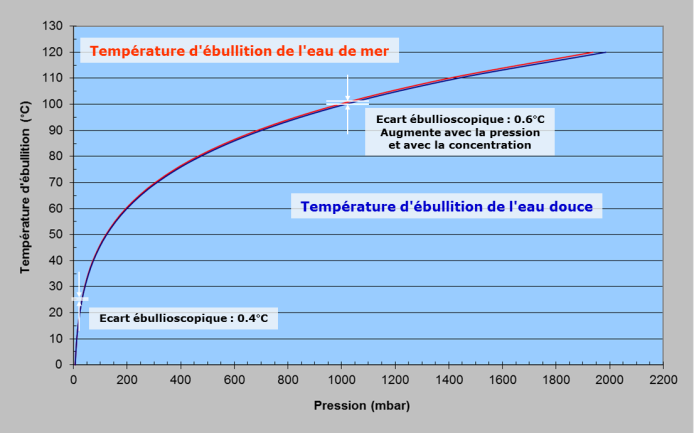
Fig. 7: Boiling temperature for sea water and freshwater [Source : author]
For reverse osmosis, the minimum energy to be supplied WRO corresponds to the work to transfer one kilogram of water(m) with a pressure difference equal to the osmotic pressure (V and ρfreshwater are the volume transferred and the density of the water):
WRO = V.Pseawater osmotic = m/ ρfreshwater.Pseawater osmotic = 0.81kWh/m3
It is quite remarkable that the two calculations corresponding to totally different physical principles finally lead to such close results. But as the initial state – water and salt mixed – and the final state – water and salt separated – are identical, the first principle of thermodynamics imposes that the energy to be used must be the same in the conditions of total reversibility, i.e. without any loss. It should be noted, however, that this minimum energy is very theoretical, since the previous calculations assume that the conversion rate is zero, i.e. that we are just around equilibrium.
5. The most commonly used industrial distillation processes
It very quickly became apparent that, in order to limit the phenomena of corrosion and fouling, and to reduce the disadvantages due to the presence of air, it is necessary to operate under reduced pressure, which lowers the distillation temperature (Rochon, 1813 [15]). Indeed, the speed of corrosion increases with temperature. Seawater contains, in addition to sodium chloride, sulphates and carbonates of calcium and magnesium, which are salts with inverse solubility: a high temperature favours their precipitation in the form of scale. While chemical cleaning can remove carbonate scale, sulphates are virtually insoluble. Therefore, operating temperatures should be chosen to avoid their formation. Without preventive chemical treatment, the maximum temperature of the sea water is generally limited to about 60 degrees. The corresponding pressure is about 200 hectopascals (1 hPa = 1 millibar, mbar), or a little less than one fifth of atmospheric pressure. This is known as reduced pressure distillation.
In addition, various distillation processes have been developed with the aim of reducing the thermal energy consumed. The thermal performance of distillation processes is characterized by the Gain Output Ratio (GOR) which is a unitless number, generally the ratio between the flow of water produced, expressed in tons per hour, and the flow of steam consumed, also in tons per hour.
5.1. The Flash Steam Process (FSP) for Mass Production
Instantaneous vaporization, better known as MSF for Multi-Stage Flash, consists of heating seawater (from 25°C to 85°C, at a pressure of 1013 mbar, in Figure 8) and then introducing it into a series of cells where the pressure is lower than the saturation pressure[16] (from 1013 to 60 mbar in the figure). The superheated water will then boil spontaneously and quite violently – hence the name “flash” – to return to the thermodynamic equilibrium state (pressure 60 mbar, temperature 35 °C). The steam produced is condensed using seawater, which is thus preheated, thus saving part of the energy required (Figure 9).
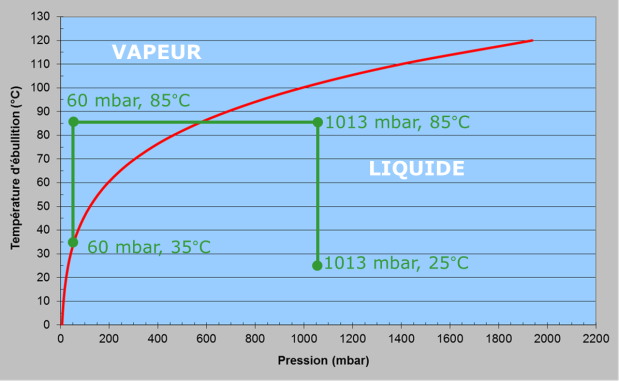
Fig. 8: Seawater saturation curve and MSF cycle [Source : author]
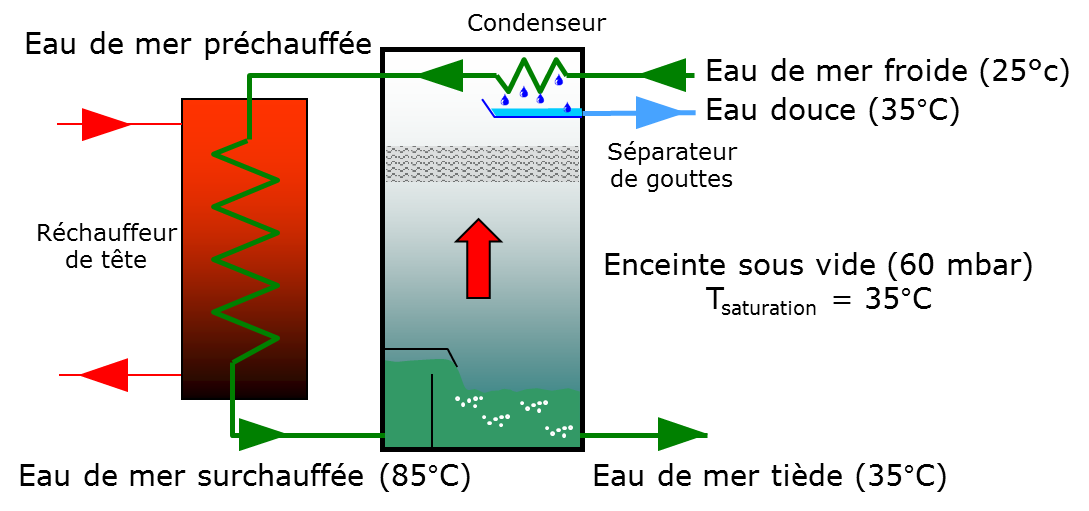
Fig. 9: MSF diagram to one cell [Source : author]
Although theoretically a single expansion stage would be sufficient, in practice it can be observed that thermodynamic equilibrium is not reached between the seawater after expansion and the saturation temperature in the chamber. This imbalance is the consequence of the various thermodynamic losses, including the boiling gap and the residual expansion gap. Moreover, operating the expansion in a single stage considerably limits the possibility of recovering thermal energy at the condenser. These two limitations invite to place several stages in series.
In practice, the expansion takes place in several cells up to 16 or even more, in which the pressure and temperature progressively decrease. Between two stages, the temperature decreases by only three or four degrees. The heat recovery is then maximum, and the thermodynamic losses are minimized. Below this point, the triggering of vaporization becomes random because of the irreversibilities that become preponderant. And the investment becomes so important that a very large number of stages is no longer economically justified.
Because of the absence of a heat exchanger for evaporation, the process is less prone to scaling than other processes. Nevertheless, the problem is transferred to the head heater, which then operates under special conditions (high circulation speed to limit incrustations, tartrifugal treatment).
To optimize the thermal scheme, the stages are arranged in two distinct sections, a heat recovery section and a rejection section (Figure 10). The GOR of this type of installation commonly varies between 7 and 12.
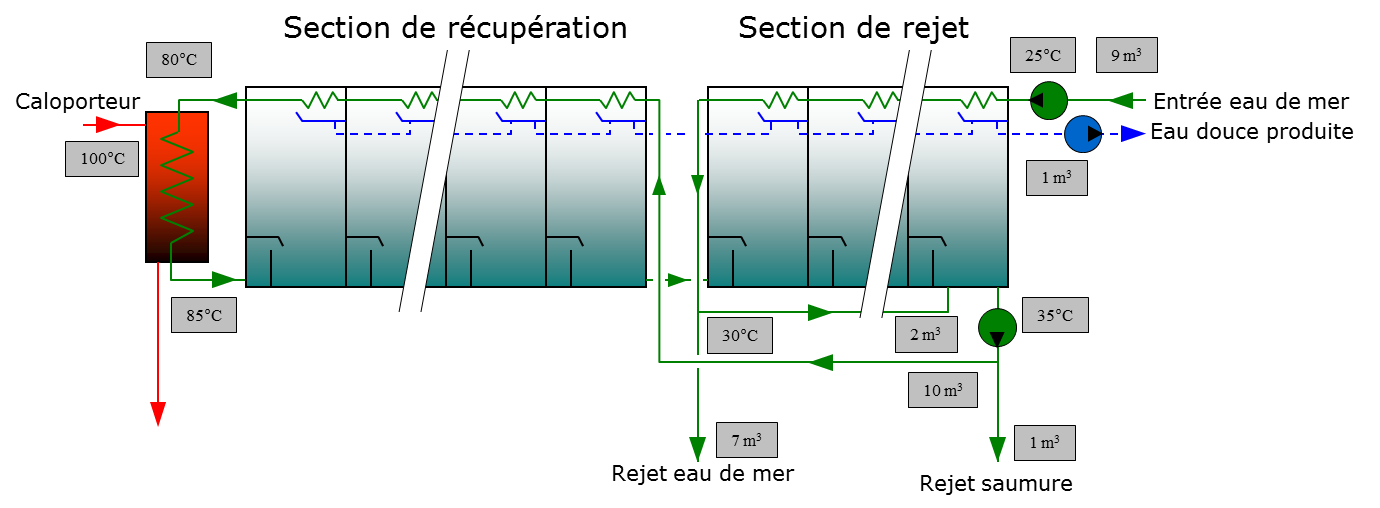
Fig. 10. MSF industrial facility [Source: author]
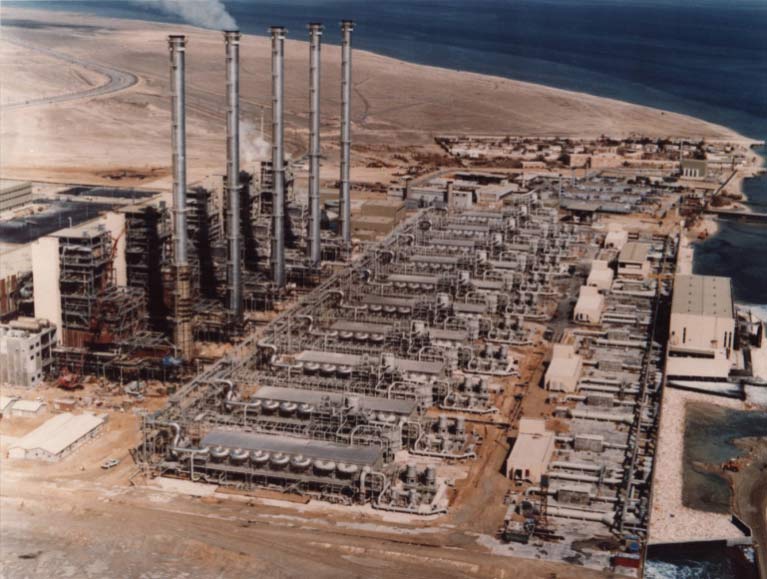
Fig. 11. Al-Khobar II desalination plant (Saudi Arabia) 223,000 m3/d MSF [Source: Veolia-Sidem]
5.2.2. Multiple-effect process (MED) for energy conservation
The Multi-Effect Distillation (MED) process was specifically developed to save thermal energy. The first attempts date back to the 19th century. The thermal power supplied to the head evaporator by a heat transfer fluid – a fluid that transports heat – is used to evaporate seawater. The steam produced is condensed in the next evaporator, which is called the first effect.
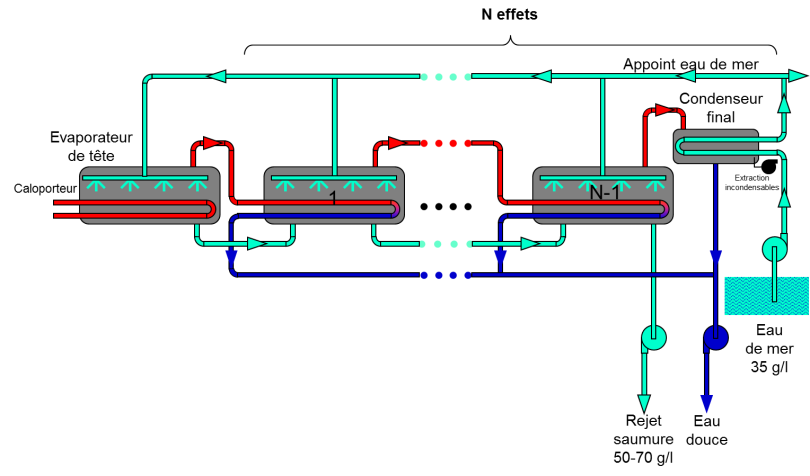
Fig. 12: Principle of the multi-effect process (MED) [Source: author]
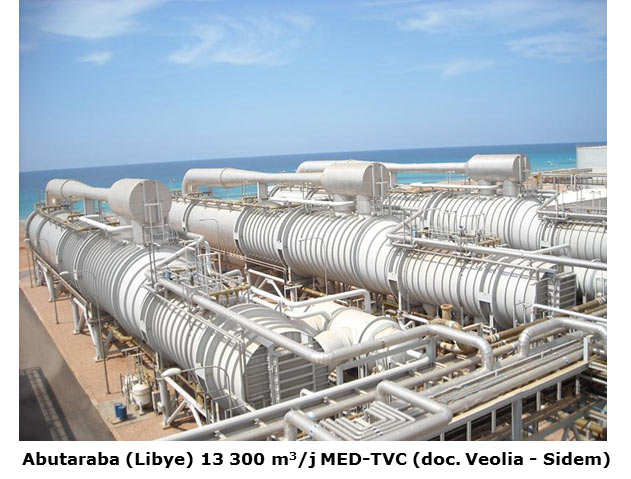
Fig. 13: Abutaraba desalination plant (Libya) 13,300 m3/d MED-TVC [Source: Veolia – Sidem]
5.3. Vapour compression (VCM, TVC): a complementary way to save energy
Vapour compression distillation is also a process for producing water with minimal energy consumption. It is always associated with the multi-effect process, where the number of effects can be reduced to one. The principle is the same as for heat pumps, but this time the working fluid undergoing the thermodynamic cycle is water. Unlike a heat pump, the thermodynamic fluid circuit is open instead of closed. Compression can be carried out with a mechanical compressor (Mechanical Vapor Compression, MVC) or with a thermocompressor (Thermal Vapor Compression, TVC).
5.3.1. Mechanical Vapor Compression (MVC)
Liquid, preheated seawater (point A in Figures 14 and 15) is evaporated at 55 degrees under reduced pressure to 160 millibars (mbar) (A→B). The resulting vapor is very slightly compressed to 200 mbar (B→C). The saturation temperature is then 60 degrees. This vapor is then condensed (C→D) but the latent heat of condensation at 60 degrees is used in the evaporator/condenser to evaporate sea water at 55 degrees. Pure, liquid water (D) can then be extracted along with brine corresponding to the unevaporated seawater fraction. As these two fluids are extracted at 55 and 60 degrees, they are used to preheat the seawater introduced into the system. Apart from the initial heating required to start the system, the main energy consumption is the electrical energy of the compressor. This is minimised by the small temperature difference. The corresponding compression ratio is therefore also very low. Here again, the limit is economic because the smaller the temperature difference (but still limited by the irreversibilities), the larger the exchange surface necessary for evaporation and condensation.
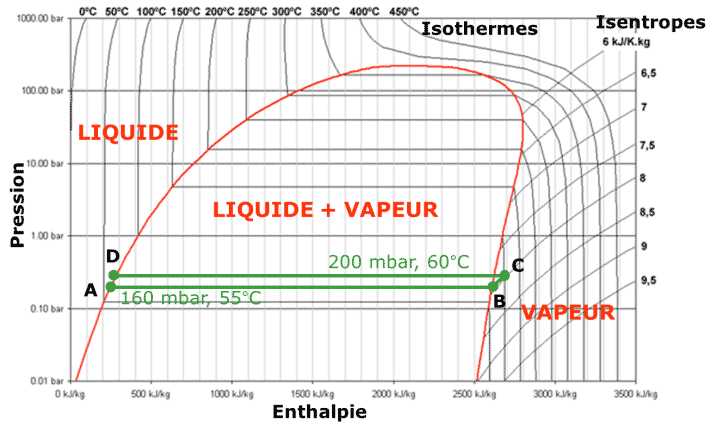
Fig. 14: Principle of the mechanical vapour compression (VMC) process [Source : author]
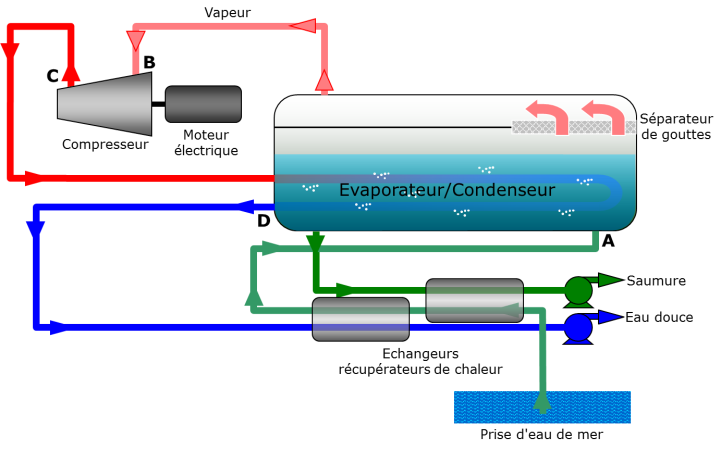
Fig. 15: Thermodynamic cycle of water in the MVC process [Source : author]
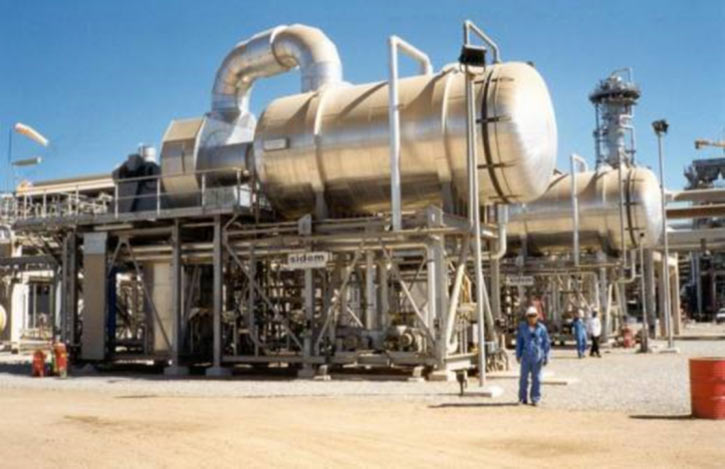
Fig. 16: Al Ghalilah desalination plant (Oman) 2 x 500 m3/d MVC [Source: Veolia – Sidem]
5.3.2. Steam thermocompression
As the size of desalination plants has never stopped growing, mechanical compression has quickly become unsuitable for large installations, because of both technical and economic limits for the compressor. Even if the efficiency decreases very quickly when the compression ratio increases, thermocompression has quickly imposed itself because the investment and the maintenance cost are extremely low.
The principle is to use a nozzle in which, by acceleration in an injector and a neck, high pressure steam sucks low pressure steam to obtain medium pressure steam. Compression takes place between the low pressure steam sucked in and the medium pressure mixture that is released. The only source of energy being the high pressure steam, it is indeed a “thermal” compression process. The performance is characterized by the flow of driving steam at high pressure necessary to drive the steam at low pressure (steam consumption per unit of steam drawn in) or by the drive ratio (driven flow per unit of driving steam).
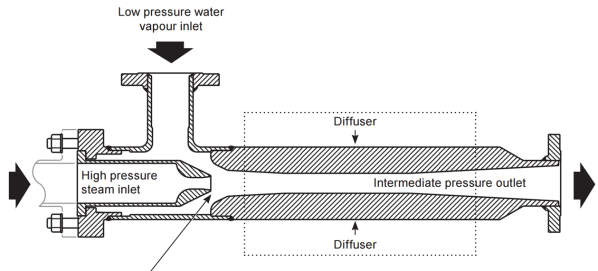
Fig. 17: Diagram of a steam thermocompressor [Source: Spirax Sarco]
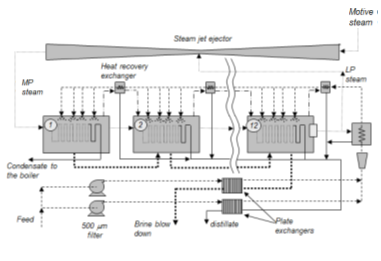
Fig. 18: Multiple-effect installation with steam thermocompression from Trapani (Sicily) [Source: Sicilian]
5.4. Comparison of different distillation processes
Data from the work of Mahmoud Abdel-Jawad (2001)[17 ] and Wangnick (2004)[18 ] allow a comparison of the different distillation processes. A summary is given in Table 1.
Table 1: Characteristics of the different distillation processes
| MSF | MED | MVC | MED-TVC | |
| Head temperature °C | <120 | <70 | <70 | <70 |
| Main energy source | Steam | Steam, hot water | Electricity | Steam |
| Heat consumption kWh/m3 | 70 – 80 | 50 – 70 | 0 | 50 – 60 |
| Electrical consumption kWh/m3 | 3.5 | 1.5 | 8 -14 | 1.5 |
| Capacity per linem3/d | 5 000 – 70 000 | 500 – 12 000 | 10 – 2 500 |
100 – 25 000 |
Distillation was for a long time the exclusive desalination process. But with the increase in the cost of thermal energy, the market has gradually turned to membrane processes. If today about half of the fresh water from sea water is produced by distillation, it is thanks to the very large desalination plants in the Middle East coupled with power plants which supply them with thermal energy at low marginal cost. The situation could change dramatically when these plants reach the end of their life.
6. The rise of membrane processes dominated by reverse osmosis
Long reserved for brackish water desalination and small capacities, reverse osmosis, a process developed in the twentieth century, has benefited from advances in membranes and energy recovery systems that have literally exploded its market. Today, if we consider all treated water, reverse osmosis represents almost two thirds of the installed capacity. It crushes the other membrane processes, which are essentially electrodialysis, membrane distillation and direct osmosis.
Other processes that will be listed below also use membranes but their development is not yet very advanced.
6.1. Reverse osmosis (RO)
6.1.1. Membranes with exceptional qualities
The principle of Reverse Osmosis (RO) is to have a porous separating membrane whose pore size is small enough – a few nanometers – to let water molecules pass through but not the much larger ions. Unfortunately, the separation is not perfect and some salt still passes through the membrane. Functionalization treatments can reinforce the selective character of these membranes and increase their separation capacity.
To limit the pressure loss due to the flow of water through these membranes and thus minimize energy consumption, they are extremely thin: their thickness is often a fraction of a micron. Since osmotic pressure opposes the flow as soon as pure water crosses the membrane, a pressure at least equal to the osmotic pressure must be applied to the water to be treated in order to force the flow in the direction of separation. The membrane therefore does not work completely like a filter because the flow must overcome the osmotic pressure in addition. We have seen that this pressure is 29105 Pa for sea water; it increases as the concentration process proceeds. In practice, to concentrate and obtain a significant flow, the operating pressure is in the order of 60 to 70105 Pa and the conversion rate of sea water to fresh water is slightly less than 50%. Of course, if the water is slightly salty, the pressure to be applied decreases and the conversion rate can be increased, which has led to reverse osmosis becoming the reference process for treating brackish water.
Working at high pressure has a second consequence. The membranes must withstand very large pressure differences. There are different types of membranes: hollow fibre or film. Hollow fibres are capillaries with an internal diameter of a few tens of microns and an external diameter of a millimetre. Thanks to these small dimensions, their resistance to pressure is excellent. However, although their surface area per unit volume is much greater than that of films – in a ratio of 10:1 – they are rarely used due to clogging and fouling issues. In the case of film membranes, the extremely thin active layer cannot withstand the pressure alone. It is therefore combined with other very porous layers that serve as a support and ensure adequate mechanical properties (Figure 19).
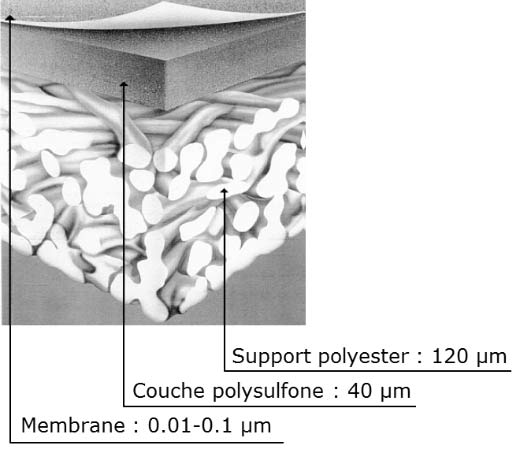
Fig. 19: Structure of a reverse osmosis membrane [Source: DR]
The films thus formed are wound with spacers that form channels for the salt water and for the pure water (Figure 20). A module thus formed has a surface area of about 40 m² with a diameter of 200 millimetres (8 inches) and a length of 1 metre (40 inches). Several modules, typically seven, are then assembled in a pressure tube (Figure 21); dozens of tubes assembled in parallel constitute a train.
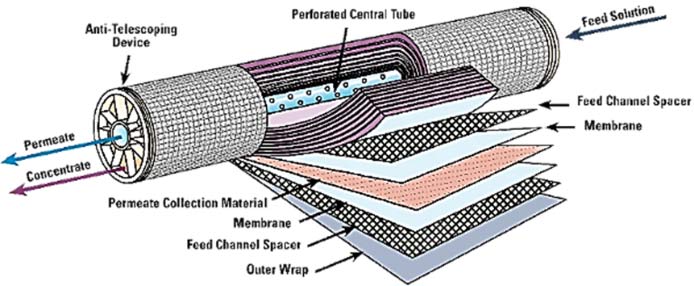
Fig. 20: Constitution of a reverse osmosis element [Source: Lenntech]
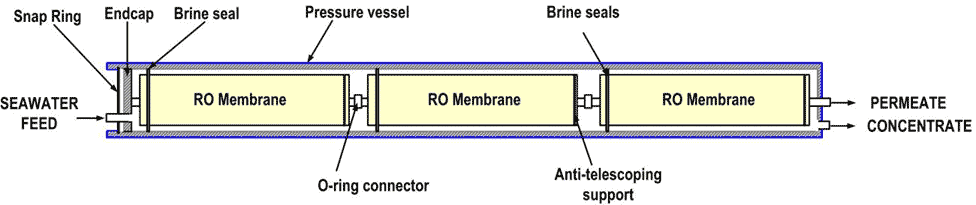
Fig. 21: Assembly of reverse osmosis elements in a pressure tube [Source: Lenntech]
The pressure tubes are then combined in very large numbers – several dozen – in a modular manner, each module being called a train, which makes it possible to achieve very high production levels, as in Ashkelon (Figure 22).
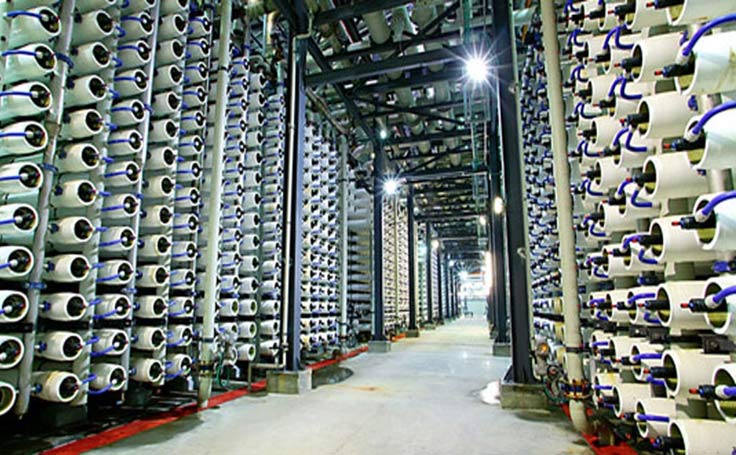
Fig. 22: Ashkelon desalination plant (Israel) – 320,000 m3/d – RO [Source: Veolia Water]
6.1.2. A concern for energy saving
As with distillation processes, the energy consumption of reverse osmosis is a major concern. Since only half of the water is extracted as fresh water from the salt water, the unit discharges a concentrated brine at a very high pressure, of the order of 60-70105 Pa, almost equal to the operating pressure of the osmosis plant. Very quickly, devices recovering this pressure energy were integrated (Figure 23). Turbines or similar systems were introduced in the early 1980s. The high-pressure brine is directed onto a turbine arranged on the same axis as the osmosis plant’s high-pressure pump, which then consumes 30 to 40% less power. Then, and although described in the 1950s, the use of pressure exchangers – isobaric systems – became widespread in the 2000s.
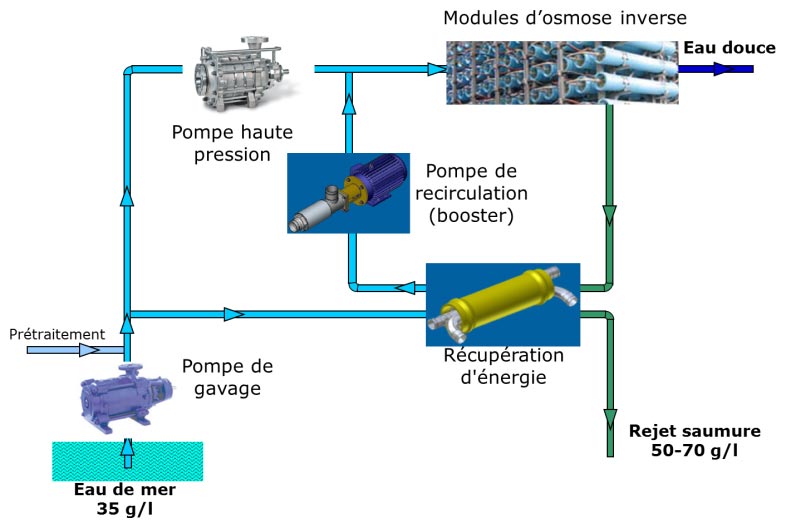
Fig. 23 : General diagram of a reverse osmosis unit [Source : author]
The principle of the pressure exchanger is based on a cylindrical channel in which the pressurized brine drives the seawater towards the osmosis plant alternately with the seawater that drives the brine towards the discharge. A set of valves and slides ensure the alternate distribution of the fluids and a piston separates the fluids. Two cylinders work in tandem to ensure continuity of all flows. But the most elaborate system is the pressure exchanger developed by the ERI company[19] (Figure 24) because it is rotary and has neither valves nor pistons. It is the pressure of the brine that ensures the rotation of the device at a speed of 1200 revolutions per minute. The recovery efficiency is over 95%. Due to the absence of a piston, the fluids mix partially but only by a few percent.
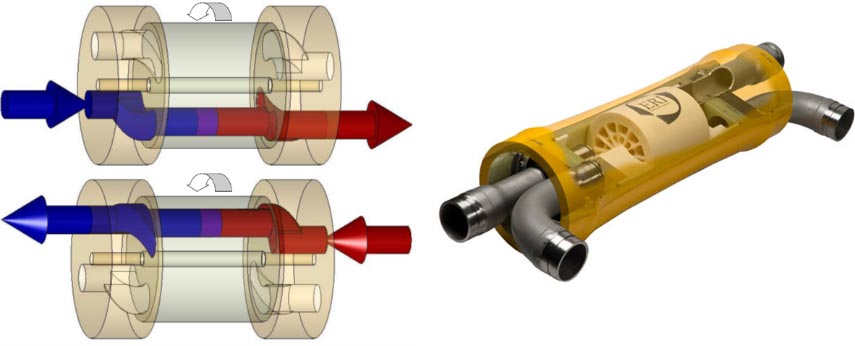
Fig. 24: Pressure exchanger [Source: Energy Recovery Inc.]
To a first approximation, the transfers in a reverse osmosis module can be described by simple relationships:
Water flow through the membrane: J1=A.(ΔP – Δπ)
Salt flow through the membrane: J2=B.(C0 – Cp)
Salt rejection rate: TR=A.(ΔP–Δπ))/(A.(ΔP–Δπ )+B)
Where J1 and J2 are expressed in kg/m².s
A is the permeability of the membrane (3 10-9 kg/m².s.Pa, 1 l/m².h.bar)
B is the salt permeability (10-7 m/s)
ΔP is the average pressure difference Pa
Δπ the mean osmotic pressure difference Pa
C0 – Cp the concentration difference kg/m3
The energy consumption of the high-pressure pump results from a trade-off between the operating pressure, the conversion rate and the installed diaphragm area. Typically, for seawater desalination, the operating pressure is set between 60 and 70105 Pa, the conversion rate is a little less than 50% and the membrane surface is about 2 m²/(m3/d). The energy consumption is between 3 and 4.5 kWh/m3. For desalination of brackish water with a salt concentration of five grams per litre, the optimum pressure is halved, the conversion rate reaches 70%, but the membrane area remains approximately the same. The energy consumption falls to between 1.5 and 2 kWh/m3.
6.1.3. Fouling – Pre-treatment
Although reverse osmosis is not a thermal process, the membranes are subject to fouling, which manifests itself in the form of mineral deposits such as scale, as well as organic deposits (biological fouling). In addition to the sanitary aspect, these deposits alter the transfer performance of the membranes, which also age, leading to their periodic replacement. However, between two changes, chemical treatments can be used to maintain or restore a state that ensures acceptable performance. These treatments are grouped together in what is called seawater pre-treatment, before proceeding with reverse osmosis. This item represents about 10% of the total investment and 10% of the final price of the water. It requires very strict monitoring at the risk of irreparably destroying the membranes. Without being systematically obligatory, the different stages of pre-treatment are :
- Filtration on different types of filters, including micro and ultrafiltration
- Flocculation, which improves the quality of the filtration; ferric salts or polyelectrolytes are used to agglomerate the particles in suspension and to settle them
- An antiscalant treatment, based on acids or phosphates
- A corrosion inhibiting treatment based on polyphosphates
- Disinfection with chlorine or sodium hypochlorite to eliminate micro-organisms present in the water
- Neutralization of the sulphite disinfectant because, based on chlorine or a chlorine derivative, the disinfectant attacks the membranes
- Adjustment of the pH because the transfer properties of the membranes are sensitive to it
- Temperature control
Work has been carried out to determine the optimal operating temperature of an osmosis plant. Indeed, by decreasing the viscosity of the water, a rise in temperature increases the production by 2 to 3% per degree. Unfortunately, the salinity of the water produced also increases by 2% per degree and the life of the membranes is shortened. Finally, in order to ensure a life span of two to four years, it can be seen that the temperature must be within a very small range of a few degrees around 28 degrees. The temperature is therefore a parameter that is monitored and not an adjustable operating parameter, at least in hot countries.
6.2. Electrodialysis (ED) to extract salt from brackish water
Electrodialysis (ED) was developed in the 1960s. The principle is not to extract pure water from the water to be treated, but rather to extract chloride and sodium ions through selective membranes. The migration of the ions is caused by an electric field (Figure 25). Although this process is well suited to the treatment of brackish water, which is not very concentrated, the electrical consumption becomes prohibitive above a salinity of 4 grams per litre. For an operating voltage of 500 V across a stack of membranes, the power consumption is 2.6 kWh/m3 for an initial concentration of 2.5 grams per litre, 3.9 kWh/m3 for 3.5 grams per litre and 5.5 kWh/m3 for five grams per litre [20] At such low concentrations, reverse osmosis quickly becomes more energy efficient.
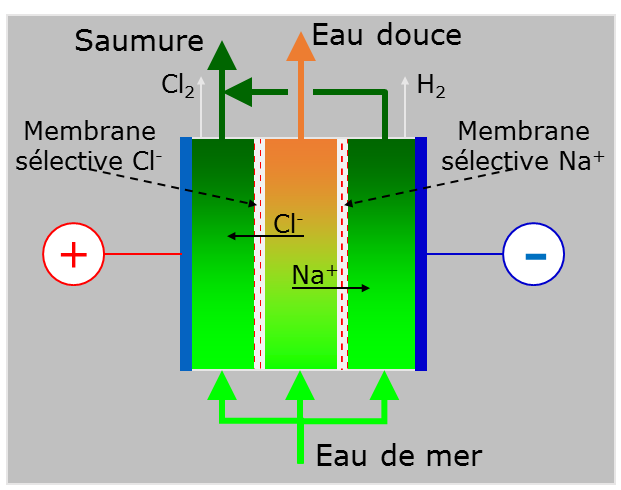
Fig. 25: Principle of electrodialysis [Source : author]
It should be noted that the process is perfectly reversible, i.e. it can produce electricity from both salt and fresh water. Insofar as the maximum electrical production can be easily calculated from the formula giving the minimum desalination energy, it is easy to understand that the process is only of interest if the salt water is very concentrated, close to saturation. Experiments have been carried out using saturated salt marsh water and, not fresh water which is too precious, but sea water. However, the interest remains anecdotal because, in addition to the low production of electricity, the electrical power consumed by the transfer pumps must be deducted.
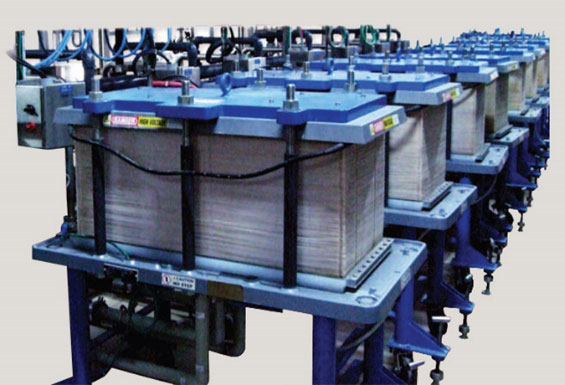
Fig. 26: Electrodialysis cells [Source: General Electric]
6.3. Membrane distillation (MD), an interesting process still under development
Similar to reverse osmosis in that water is extracted, membrane distillation (MD), a process that dates back to the 1960s, differs in that a difference in vapour pressure is used as the driving force, and not pressure in the mechanical sense, to carry out the transfer (Figure 27) [21] It is therefore an atypical membrane process that consumes mainly thermal energy.
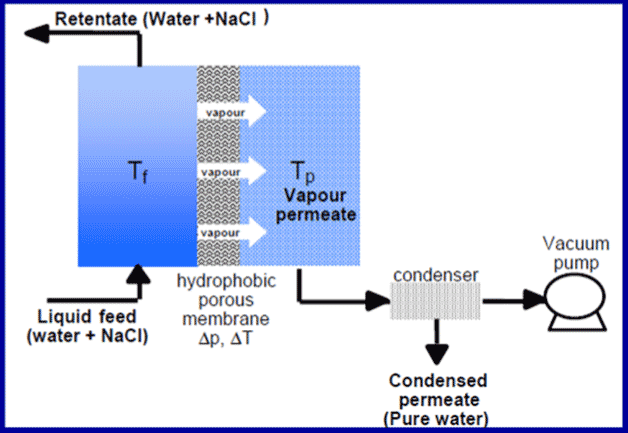
Fig. 27: Principle of membrane distillation [Source: R.Ben Aïm]
Membrane distillation must not be confused with pervaporation, which combines adsorption and desorption phenomena. The membranes are hydrophobic and work in exactly the same way as technical textiles covered with a hydrophobic fluorinated membrane that forms a barrier to rain but evacuates water vapour from perspiration. The process works around 70 degrees on the warm side, the temperature difference with the cold side is 10 to 20 degrees. Due to this temperature difference inducing a difference in partial pressure of water vapour, vapour migrates through the membrane and condenses at the cold end (Figure 26). The system operates under vacuum so that there is no residual air that would penalize the diffusion transfers. In order to reduce energy consumption, the salt water flowing through the condenser is heated and therefore enters the head heater preheated. This thermal scheme is very similar to the MSF process.
The membranes are 40 to 250 micrometers (µm) thick and are made of polyvinylidene fluoride (PVDF), polypropylene (PP) or polytetrafluoroethylene (PTFE, well known as Teflon™). The pore size does not exceed 0.2 micrometers. The advantage is that distillation can be achieved in a very compact device using a low temperature heat source with very low power consumption of the ancillary pumps – in the order of kilowatt hours per cubic meter of water produced. Compared to reverse osmosis, the membranes have a very good selectivity and are much less sensitive to fouling and oxidants used as biocide. The pre-treatment is therefore very simplified. Nevertheless, the industrial stage has never been reached for desalination because of the low steam fluxes obtained through the membranes and finally the thermal energy consumption which remains high to maintain a significant flux. The GOR does not exceed 4 to 6. The prototypes carried out show the compactness of the installations (Figure 28)[22].
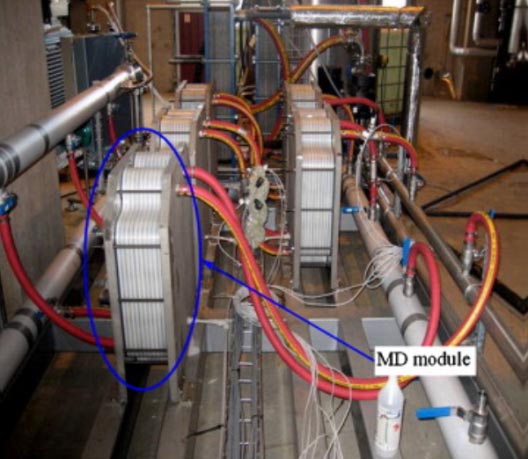
Fig. 28: Membrane distillation modules [Source: Global Water Intelligence, DesalData.com]
7. Many possible water desalination processes under development
Starting from the observation that the current processes consume much more energy than the minimum energy of desalination, even if this one can never be reached, many investigations have been carried out to imagine desalination processes which are energy saving, simple and globally the least expensive possible to increase the accessibility to water of the populations. If a lot of work is currently underway, the basic principles had often been established as early as the 1960s, or even before. Recent advances in nanotechnology and especially nanomaterials have opened up new opportunities. Biotechnology also seems to offer possibilities. Here are some unconventional desalination technologies, some of which have not been developed while others are considered promising.
Freezing is a natural process. The sea water ice forming the pack ice is much less salty than the sea. Since the water in the water + salt mixture is overwhelmingly water, freshwater ice forms first during the freezing process. Unfortunately, small pockets of sea water are trapped in the ice and pollute the fresh water obtained afterwards by melting the ice. The process is nevertheless attractive because the enthalpy of solidification of the water is much lower than that of vaporization: 335 kJ/kg (93 kWh/m3) against 2260 kJ/kg (630 kWh/m3). It should be noted, however, that the cold required for freezing must be produced by a refrigerating machine that consumes noble energy, either electric (refrigeration unit) or thermal at medium temperature (absorption machine). In any case, even when reduced to a primary energy source, the energy balance remains very much in favour of freezing. The cold, stored in the form of ice, can be used for air conditioning purposes. A few pilot installations were carried out in the 1960s in the United States, Israel and the United Kingdom, but given the ultimately mediocre performance and the problems of purity of the water produced, there was no follow-up.
ForwardOsmosis (FO) seems to be developing. The principle of this membrane technique is to bring seawater into contact with a highly concentrated solution, through a membrane that allows only the water to pass. Under the effect of the very strong concentration gradient, the water will migrate towards the concentrated solution. This is a solution of a volatile salt, such as ammonium carbonate. The diluted solution obtained is then heated in order to expel the volatile salt in the form of gaseous ammonia and carbon dioxide. These two gases are again dissolved in part of the purified water obtained to reconstitute the concentrated solution, while the other fraction undergoes finishing (reverse osmosis or nanofiltration) to eliminate the residual traces of ammonium carbonate. The whole process requires only a little heat at about 50 degrees to regenerate the solution and a little electricity for the circulation pumps. The comparison with reverse osmosis seems to favour direct osmosis for high conversion rates[23]
The idea of using solvent extraction for desalination is not new [24] Two strategies are possible: either the water is extracted towards the solvent, or the salt is extracted. In all cases, the solvent must be regenerated by heating and recycled; its solvent power must therefore vary greatly with temperature. The relevance of the process therefore lies in the choice of the solvent. To extract water, secondary and tertiary amines can be used, although their residual concentration in the water produced makes final purification essential. To extract the salt, which is much rarer because the water and the solvent must be totally immiscible, polymeric solvents can be used. Given the potential stakes, their composition is kept secret. This technique is not yet at the industrial stage for desalination.
The humidification-dehumidification of air has developed a lot in the last ten years. It is about imitating the natural water cycle in nature. Air is saturated with moisture by contact with warm seawater and the resulting warm, moist air is cooled to condense the moisture it contains. Seawater can be heated from any heat source but a solar source is often preferred. The cold source for condensation is simply seawater fed to a condenser. The advantage of this process is that it operates at atmospheric pressure and its simplicity and operating temperature allow the extensive use of low cost plastic materials. Although modest, the performances are interesting (GOR 4 to 5). This process is well adapted to small capacities. Manufacturers[25] limit themselves to a capacity of about fifty cubic metres per day.
Capacitive deionisation simply consists of passing the water to be desalinated through a channel whose walls are made up of porous electrodes. Under the effect of an electric field, the ions migrate towards the electrodes where they remain trapped. If the channel is long enough – it can be up to 10 metres long – the water comes out free of salt. Periodically, the polarity of the electrodes is reversed to flush out the salt; a concentrated brine then emerges from the channel. This is a process in which the salt is removed, not the water. It appears to work with highly charged solutions – up to 100 grams per litre – with a conversion rate of over 80% [26].
Electrodeionization is a hybrid process between electrodialysis and ion exchange resin treatment. It is also suitable only for waters with low loads and low hardness (< 1 milligram per litre). It allows to obtain ultra-pure water (polishing of osmosis water for example). Under the effect of an electric field, sodium and chloride ions are expelled through selective membranes. The electro-neutrality is restored by the hydronium and hydroxyl ions of the resins. The dissociation of the water under the effect of the electric current allows the regeneration of the resins in-situ. The process therefore works continuously without consuming chemicals[27]
The Thermo-Ionicprocess[28] is also a process using selective membranes. Seawater is concentrated by evaporation by simple spraying into the air to about 180 grams per litre. It is then brought into contact with unconcentrated seawater through a hydrophobic membrane that allows sodium ions to pass through on the one hand and a hydrophobic membrane that allows chloride ions to pass on the other. Under the effect of the concentration gradient, the ions migrate from the concentrated water to the unconcentrated seawater. The latter is also in contact with a second circuit of unconcentrated seawater through identical membranes. It is then the ions of this second circuit that will migrate to restore the electro-neutrality of the first circuit. The second circuit is depleted in salt while the first is enriched. There is indeed desalination of water by combining the effect of a concentration gradient and then of an electrical gradient. Although the specific consumption is given as around 1 kilowatt-hour per cubic metre of fresh water produced to circulate the fluids, which is very low, there does not seem to be any industrialization of the process; probably because of the low rate of salt rejection due to the inverse gradients, unfavourable to the desired transfer.
Studied by the Massachusetts Institute of Technology, ionic concentration by polarization derives from nanotechnology. A mini channel, with a characteristic size of 500 micrometers, separates into two sub-channels. Salt water is fed to the main channel while an electrical bias is applied at the separation. A local depletion of ions occurs, leading to an enrichment of the outflow from one branch while the other becomes depleted. The salt rejection rate was measured at 99% for a conversion rate of 50%. The specific electrical consumption is 3.5 kilowatt hours per cubic meter. This performance puts the device on a par with reverse osmosis. But it is obvious that it is very sensitive to fouling and that a significant production rate – only 1 microliter per minute per device – can only be achieved with a very large number of devices operating in parallel. An architecture allowing to go to a thousand times higher throughput has been tested but is still far from an industrial process[29].
Hydrogels are hydrophilic polymers that have the property of absorbing the water contained in the salt water in which they are immersed. After rinsing, they can release the water they have absorbed either by heating or by pressing. Any other stimulation is possible to restore the water: pH, electric or magnetic field, light, etc. Their base is a functionalized polyacrylate to give it the right properties. The absorption capacity is of the order of 1000 times in mass. The characteristic time of a cycle is about thirty minutes. The energy required to recover the water seems to be a very limiting point at present: between 20 and 40 kilowatt hours per cubic metre per mechanical pressing[30].
Gas hydrates (chlathreates) are crystals that look like ice but are formed by water molecules that trap a gas such as methane or carbon dioxide. Many other gases can be considered. The proportion of water trapped is 85% in the case of methane. Once formed, the hydrates, which are solid, can be separated from the brine and decomposed to obtain water and recycle the gas. The principle had been identified as early as the 1940s without paying more attention to it at the time. Unfortunately the presence of salt tends to inhibit the formation of hydrates. Hydrate formation typically occurs around zero degrees under several bars of pressure in the case of propane hydrate. The fact that seawater and gas must be cooled to form the hydrate under pressure and then heated to decompose it still makes the process highly questionable for industrial use. Nevertheless, the field is completely open to find a more efficient water/gas couple[31].
Biodessalination is based on the affinity of certain plants or bacteria for salt. Experiments have been conducted with cyanobacteria and with a variety of water lilies. Sunlight is the energy source for the transfers. The separation is not complete, for the moment only variations in concentration have been observed. The extracted salt is incorporated into the biomass produced[32].
Moisture capture processes provide an interesting alternative for small capacities. As nature naturally proceeds with the first step of distillation by evaporating seawater, water vapour is eventually present everywhere in the atmosphere, which only needs to be condensed to obtain fresh water. If the site is suitable, as for example on oceanic islands, condensation in the form of fog also occurs naturally during the night. Water can then be collected by stretched webs on which the fog droplets impact, coalesce and run off. With a relative humidity of 100%, up to 2 litres of water can be collected per night and per square metre of fabric[33].
To “force” the formation of dew, emissive surfaces can lower the temperature of humidity sensors on which the ambient humidity will condense. These systems also work at night, when the relative humidity is maximum and the radiation from the sensor towards the night sky allows cooling. Finally, a refrigeration machine can also be used to lower the air temperature below its dew point and thus obtain water by condensation.34] This last principle remains very energy-intensive because it requires cooling a lot of air to obtain little water (130 cubic metres of air per litre of water for a climate of 30 degrees and 40% relative humidity).
Humidity traps are also being studied. They consist of a carpet of carbon nanotubes whose end exposed to the air is hydrophilic while the end at the bottom of the tubes is hydrophobic. The assembly is hygroscopic, i.e. it spontaneously captures the surrounding humidity and water is trapped in the assembly. A mass of water equal to 80% of the mass of the nanotubes was obtained in 13 hours in saturated air. Evaporation appears to be very slow once the water is trapped. Recovery of the water requires pressing[35].
Cloudseeding to artificially induce rain has been experimented. Ions obtained by ionizing the air can be used as seeds, silver iodide crystals or simply ice crystals.
8. Environmental considerations
Is desalination environmentally friendly? This is a vast debate. If a survey carried out in the early 2000s in San Diego County (USA) showed that only 14% of the population had a bad opinion of desalination[36], very active movements have been formed, as in Australia, to oppose the construction of desalination plants. ” I have always thought that the minimisation of the impact on the marine environment would condition the development of desalination. It is the environmental movements that are currently holding back several projects in California and Florida ,” emphasised Jean-Michel Herewyn, CEO of Veolia Water, in a 2012 interview with Le Monde[37].
It is a fact that this aspect is taken very seriously in projects but also in research work: we have thus shown, on the basis of a bibliometric study, that 17% of the articles devoted to desalination over the period 1971-2011 refer to environmental aspects. What is the situation?
First, it should be noted that on a global scale, taking into account the water cycle, salinity does not change. Desalinated water eventually returns… to the sea in the form of wastewater or rain if it evaporates. On a local scale, it can be totally different.
There are several sources of environmental disturbance. First of all, we have seen that a desalination plant discharges brine that is concentrated about twice, at 70 grams of salt per litre. The principle adopted is to dilute this brine as quickly as possible. For distillation processes, this dilution takes place at the plant by mixing the brine with the seawater that comes out of the condenser, which makes it possible to lower the concentration to about 40 grams per litre. A dispersion at sea completes this dilution. For reverse osmosis, only the dispersion at sea allows the dilution of the brine. A common criterion is that the increase in salinity must be less than one gram per litre at 75 metres from the discharge point. Many studies exist on diffusers that allow this dilution. For distillation processes, the discharged seawater is also slightly warmed since it has been used to condense steam and dilute warm brine. This temperature increase is limited to a few degrees at the point of discharge and again, dilution quickly limits the disturbance.
But that’s not all. We have seen that the pre-treatment of seawater entering desalination plants employs a vast array of chemical products. An ever-increasing control of the installations’ management allows to limit their use as much as possible, whose economic impact is not negligible, and most of the reagents simply disappear, consumed by the chemical reactions they provoke. However, a residual concentration is released, which has led to the estimation that, because of the desalination plants, 65 tons of antiscalants, 24 tons of residual chlorine and 300 kilograms of copper from corrosion products are released into the Arabian Gulf every day[38]
9. Market and economic aspect of water desalination
The environmental impacts mentioned above have not, up to now, affected the dynamics of the water desalination market; they weigh little in comparison with the needs and the cost reduction obtained (table 2 in annex). In the standard cases, the latter are broken down into 1/3 for energy, 1/3 for investment and 1/3 for operation for reverse osmosis processes. In the case of distillation, it is more like 40, 30 and 30 %.
The cumulative capacity of the desalination plants that have been installed in the world shows a continuous growth for nearly 30 years to exceed today 100 million cubic meters per day for more than 17,000 installations (small units and those embarked on ships are not taken into account) (Figure 29). If we consider only the installations in operation (Figure 30), the daily production capacity is 75 million cubic metres[39]. This figure includes water produced from the sea and brackish water. Nevertheless, this volume remains low compared to world water consumption, of which it represents only about 1%.
Installed capacity is growing at about 10% per year. Unsurprisingly, the countries of the Gulf, the Middle East and North Africa account for most of the production capacity – nearly 50%. More surprisingly, North America accounts for 13% of global capacity: the United States desalinate a lot of brackish water by reverse osmosis in the particularly arid southwestern states. Western Europe – Spain, Greece, Italy – already hit by water shortage, has recourse to desalination to supply its islands but also large cities such as Barcelona which has a plant producing 200,000 cubic meters per day by reverse osmosis.
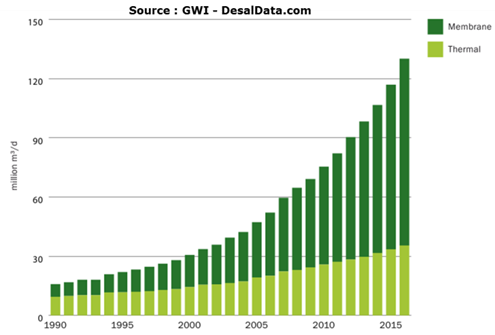
Fig. 29: Cumulative capacity of desalination plants worldwide [Source: Global Water Intelligence, DesalData.com]

Fig. 30: Desalination capacity in operation in 2015 and breakdown by geographical area [Source: Global Water Intelligence, DesalData.com]
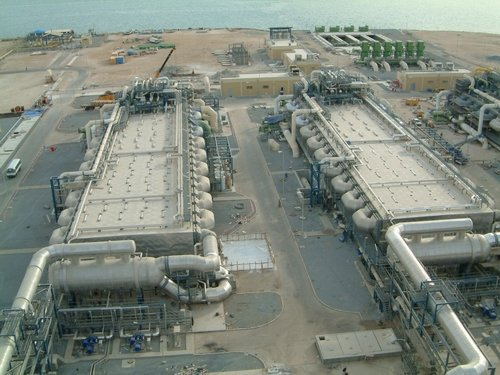
The largest desalination plant currently in operation is the Ras Al Khair plant in Saudi Arabia, which produces 728,000 cubic meters per day in eight multiflash lines (MSF) and 17 reverse osmosis lines. It is coupled with a power plant that provides both electricity and heat for the operation of both desalination processes. This is called a hybrid plant.
For the reverse osmosis process, the largest capacity currently in operation is the Sorek plant in Israel. Built by IDE Technologies (Israel Desalination Enterprises), it produces 627,000 cubic metres per day, which brings to 50% the share of water consumed in Israel coming from desalination[40]. The cost price of the water produced is only US$ 0.58 per cubic metre.
Conversely, there are very small desalination plants intended for pleasure, domestic production or emergency equipment. Their capacity, which does not exceed a few litres per day, covers the bare necessities. They may be solar-powered, like the Mage water cone (Figures 31 and 32).
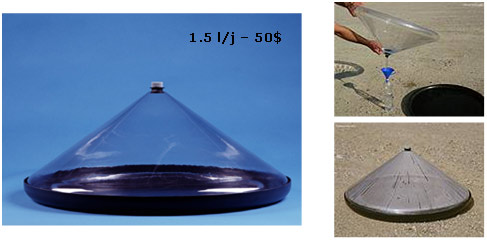
Fig. 31: Micro solar desalination equipment [Source: Mage Watermanagement]
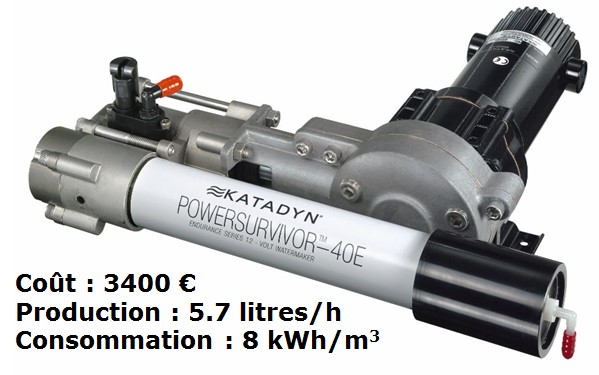
Fig. 32: Micro osmosis unit for the pleasure marine [Source: Katadyn]
The players present on the desalination market are multiple. Many are present exclusively on the reverse osmosis market, whose growth is spectacular. They are often assemblers who buy the components – mainly membranes, pumps and energy recovery units – to manufacture and deliver turnkey installations. Others are present in both the reverse osmosis and distillation markets.
Very few are exclusively interested in distillation, except in the very special case of distillers on board ships, which produce water from the heat recovered from the engine cooling system.
Because of its mastery of both processes, the French group Veolia Water, which has integrated the company Sidem into the group, is the world leader in desalination in terms of installed capacity. If we add Degrémont (Suez group), France is largely the first supplier of desalination plants in the world. Among the main world suppliers, we can still mention General Electric Water and Process Technologies (United States), Fisia (Italy), Doosan (Korea), Sasakura (Japan), Hitachi (Japan), IDE (Israel), Alfa Laval (Sweden), etc.
10. Conclusion
With a daily production capacity of 75 million cubic meters per day in 2015, it can be said that sea and brackish water desalination is a mature industrial activity. Each year, the installed capacity increases by 10%, which represents a market of more than one billion dollars. The cost of the plants and of the water produced depends on multiple factors and in particular on the cost of the energy, thermal and electric, used for desalination. For large plants producing several hundreds of thousands of cubic meters per day, the investment price can go down to less than 1000 dollars per cubic meter per day, while the price of the produced water can go down to between 0.5 and 1 dollar per cubic meter.
While a few processes hold almost the entire market, mainly reverse osmosis – which is growing rapidly – and distillation, research into new methods is very active.
The technical challenge is to develop processes that are ever more energy-efficient, if possible renewable, while seeking to get closer to the ultimate limit of minimum desalination energy, while being environmentally friendly. The economic ambition is for desalinated water to finally become accessible to populations for whom current technologies are still out of reach due to investment costs. From this point of view, solar technologies with a small production capacity, possibly not very efficient but with a very low investment cost, can have their place alongside the huge market of very large plants.
11. Annex
Table 2: Summary comparison of the different water desalination processes
| Process* Thermal energy | Thermal energy
kWh/m3 |
Electrical energy
kWh/m3 |
Water quality**
mg/l |
Investment desalination
US$/(m3/d) |
Water price
US$/m3 |
| MSF | 70 – 80 | 2,5 – 5 | 10 | 1200 – 2500 | 0,6 – 2 |
| MED | 40 – 65 | 2 – 2,5 | 10 | 900 – 2000 | 0,5 – 1,5 |
| MVC | 0 | 7 – 12 | 10 | 1100 – 3500 | 2 – 2,6 |
| MED-TVC | 50 | 1 – 2 | 10 | 1000 – 2000 | 0,5 – 1 |
| SWRO | 0 | 4 – 6 | 400 – 500 | 900 – 2500 | 0,5 – 2 |
| BWRO | 0 | 1,5 – 2,5 | 200 – 500 | 300 – 1200 | 0,3 – 1,5 |
| ED | 0 | 1,5 – 4 | 150 – 500 | 300 – 400 | 0,6 – 1 |
| Solar
CSP+MED |
40 – 65 | 2 – 2,5 | 10 | 900 – 2000 | 2,4 – 2,8 |
| Solar
PV+SWRO |
0 | 4 – 6 | 400 -500 | 900 – 2500 | 12 – 16 |
| Solar
PV+BWRO |
0 | 1,5 – 2,5 | 200 – 500 | 300 – 1200 | 7 – 9 |
| Solar
PV/ED |
0 | 1,5 – 4 | 150 – 500 | 300 – 400 | 10 – 12 |
| Wind SWRO | 0 | 4 – 6 | 400 – 500 | 900 – 2500 | 2 – 10 |
| Wind BWRO | 0 | 1,5 – 2,5 | 200 – 500 | 300 – 1200 | 1 – 5 |
| Wind VMC | 0 | 7 – 12 | 10 | 1100 – 3500 | 5 – 8 |
| Geothermal
MED |
40 – 65 | 2 – 2,5 | 10 | 900 – 2000 | 2 – 3 |
Sources: al-Karaghouli A., Kazmerski L.L. (2012)[41 ] and Ghaffour N., Missimer T.M., Amy G.L. (2013)[42]
*MSF: Multistage Flash, multi-stage instantaneous spray
ED: Multi-Effect Distillation
MVC: Mechanical Vapor Compression
MED-TVC: Multi-Effect Distillation-Thermal Vapour Compression
SWRO: Seawater Reverse Osmosis
BWRO: Brackish Water Reverse Osmosis
ED: Electrodialysis
CSP: Concentrated Solar Power (with Rankine cycle producing electricity)
PV: Photovoltaic
*Salt concentration in produced water. One pass for reverse osmosis
Notes and references
[1] World Health Organisation (2015) Progress on sanitation and drinking water, 2015 update and MDG assessment, 90p Available at http://apps.who.int/iris/bitstream/10665/177752/1/9789241509145_eng.pdf?ua=1[Accessed 2/10/2016]
[2] United Nations (2006) Water, a shared responsibility [2nd UN World Water Development Report UN-WATER/WWAP/2006/3] Available at http://www.unesco.org/new/fr/natural-sciences/environment/water/wwap/wwdr/wwdr2-2006/downloads-wwdr2/ [Accessed 02/10/2016]
[3] Howard Guy, Bartram Jamie (2003), Domestic Water Quantity, Service Level and Health, World Health Organization, 33p. Available at http://www.who.int/water_sanitation_health/diseases/WSH03.02.pdf [Accessed 07/11/2016]
[4] These reasons are identified in the various UN WWAP (World Water Assessment Programme) reports available at http://www.unesco.org/new/en/natural-sciences/environment/water/wwap/wwdr/ and summarized on p. 7 of Cosgrove Catherine E. and Cosgrove William J. (2012). The Dynamics of Global Water Futures Driving Forces 2011-2050. Paris: UNESCO, 94p [Report on the findings of Phase One of the UNESCO-WWAP – Water Scenarios Project to 2050] Available at http://unesdoc.unesco.org/images/0021/002153/215377e.pdf [Accessed on 02/10/2016]
[5 ] According to WWAP (2009), rapid population growth has led to a tripling of water withdrawals over the past fifty years. WWAP (2009), World Water Development Report3: Water in a Changing World – Facts and Figures. p8. Paris: UNESCO. Available at http://www.unesco.org/new/en/natural-sciences/environment/water/wwap/wwdr/wwdr3-2009/ [Accessed 02/10/2016]
[6] CNRS. Scientific dossier: water. Available at: http: //www.cnrs.fr/cw/dossiers/doseau/decouv/cycle/stocksEau.html [Accessed 07/11/2016]
[7 ] Own calculation made from coastal zone population data in 2010 from Center for International Earth Science Information Network – CIESIN – Columbia University (2012). National Aggregates of Geospatial Data Collection: Population, Landscape, And Climate Estimates, Version 3 (PLACE III). Palisades, NY: NASA Socioeconomic Data and Applications Center (SEDAC) Available at http://dx.doi.org/10.7927/H4F769GP [Accessed 07/11/2016] and the United Nations 2010 world population data of 6,929,725,043. Source: United Nations (2015) Department of Economic and Social Affairs, Population Division, World Population Prospects: The 2015 Revision, (DVD Edition) Available at: https://esa.un.org/unpd/wpp/Download/Standard/Population/ [Accessed 07/11/2016]
[8] James D. Birkett (2012). The History of Desalination Before Large-Scale Use, in Desalination and Water Resources – History, Development and Management of Water Resources,Vol.I. Paris: Unesco. pp.381-434 I (Encyclopedia of life support systems)
[9 ] S. Loeb (1981). The Loeb-Sourirajan Membrane: How It Came About, in Turbak A.F. Synthetic membranes. Washington, DC: American Chemical Society. 9p. (ACS Symposium Series). doi: 10.1021/bk-1981-0153.ch001. Available at: http: //pubs.acs.org/doi/pdfplus/10.1021/bk-1981-0153.ch001?src=recsys [Accessed 23/11/ 2016]
[10 ] Cited by: Pastor Jean, Pauli Anne-Marie (1995). Dialysis. Chromatography and separative techniques. Paris: Techniques de l’Ingénieur – p 1525. Available at: http: //www.techniques-ingenieur.fr/base-documentaire/mesures-analyses-th1/chromatographie-et-techniques-separatives-42385210/dialyse-p1525/ [Accessed 23/11/2016]
[11 ] RUMEAU Michel. Membranes, transfers. Encyclopædia Universalis. Available at: http: //www.universalis.fr/encyclopedie/membranes-transferts/ [Accessed on 23/11/2016]
[12 ] For a cost of the wood kWh of €0.04 including VAT (2015 data, domestic consumers in France) and of the electricity kWh of €0.15 excluding VAT (2015 EUROSTAT data, highest European industrial tariff). Source: Commissariat général au Développement durable, Observation et statistiques, prix des énergies. Available at http://www.statistiques.developpement-durable.gouv.fr/energie-climat/r/prix-energies.html?tx_ttnews%5Btt_news%5D=23473&cHash=998f1a70b7e362103a6872b902a95f70 [Accessed on 23/11/2016]
[13 ] By way of comparison, at the tap in France in 2016, we pay between €3 and €6/m3, all inclusive (water supply and sanitation). The “production” part (drawing, potabilization and transport) represents less than half of this. Source: National Observatory of Water and Sanitation Services. Available at: http: //www.services.eaufrance.fr/
[14] For example, those of Laboceano, the Brazilian Laboratory of Ocean Technology: http: //www.laboceano.coppe.ufrj.br/ittc2011/documents/2011/pdf Procedures 2011/7.5-02-01-03.pdf [Accessed 04/11/2016]
[15 ] M. Rochon (1813). Memoir on the purification of sea water, rendered potable without the taste of empyreum, by distillation in a vacuum, Journal of Physics, Chemistry and Natural History and Arts, Vol.76, p. 373
[16] The saturation pressure is the pressure that ensures liquid-vapour equilibrium at a given temperature (in red in figure 8)
[17 ] Mahmoud Abdel-Jawad (2001). Energy sources for coupling with desalination plants in the GCC countries. (consultancy report prepared for ESCWA)http://faculty.ksu.edu.sa/Almutaz/Documents/Energy Consumption and Performance for Various Desalination Processes.pdf
[18] Wangnick (2004), IDA Worldwide Desalting Plants Inventory, Report n°18. Wangnick Consulting GmbH, Germany
[19] http://www.energyrecovery.com/water/px-pressure-exchanger/ [Accessed 04/11/2016]
[20] M. Abdel-Jawad (2001).op cit
[21 ] Ben Aïm R. (2009). Les nouvelles séparations membranaires, Paris: Journées Techniques SF2P, 5 Nov, Available at: http: //sf2p.separation.free.fr/PdF/P3-Benaim.pdf [Accessed 04/11/2016]
[22 ] Kullab A., Martin A.(2011). Membrane distillation and applications for water purification in thermal cogeneration plants, Sep. Purif. Technol., Vol.76, pp. 231-237.
[23] Mazlan N. M. et al. (2016). Energy consumption for desalination – A comparison of forward osmosis with reverse osmosis, and the potential for perfect membranes. Desalination, vol. 377, pp.138-151
[24] Davison et al. R. (1960) Structure and amine-water solubility in desalination by solvent extraction. Journal of Chemical Engineering Data, vol. 5, no. 4.
[25] TMW, Mage Water Management, Altela, Terrawater
[26 ] Atlantis™ , http://www.atlantis-water.com/
[27] Institut für Chemische Verfahrenstechnik (2009) Electromembrane processes: state-of-the-art processes and recent developments, Univ. Stuttgart, Available at: https://ocw.mit.edu/courses/mechanical-engineering/2-500-desalination-and-water-purification-spring-2009/readings/MIT2_500s09_read12.pdf [Accessed 23/11/2016]
[28] Saltworks Technologies, http://www.saltworkstech.com
[29 ] Kim Sung Jae et al. (2012). A portable and high energy efficient desalination/purification system by ion concentration polarization. Nanosystems in Engineering and Medicine, Proc. of SPIE 2012, Vol. 8548 85483R-1, Available at: http://dx.doi.org/10.1117/12.2000052 [Accessed 07/11/2016]
[30 ] Höpfner J. (2013). A new method of seawater desalination via acrylic acid based hydrogels, Karlsruher Institut für Technologie (KIT) (Dissertation) Available at: http: //www.ksp.kit.edu/9783731501435 [Accessed 07/11/2016]
[31 ] Jitendra S. Sangwai and al. (2013) Desalination of seawater using gas hydrate technology – Current status and future direction, IIT Madras, Chennai, India (Proceedings of Hydro 2013 International, 4-6 Dec) Available at: https://www.researchgate.net/publication/259266834_DESALINATION_OF_SEAWATER_USING_GAS_HYDRATE_TECHNOLOGY_-_CURRENT_STATUS_AND_FUTURE_DIRECTION [Accessed 04/11/2016]
[32] Arámburo-Miranda A.V. et al. (2014). Desalination of sea water with aquatic lily (Eichhornia crassipes). 4th Int. Symp. on Environmental Biotech. and Eng. DOI 10.1007/s11356-016-7160-9
[33] Clus O. (2007). Radiative condensers of atmospheric water vapour (dew) as an alternative source of fresh water, thesis of the University of Corsica.
[34] Eole Water, http://www.eolewater.com/fr/index.html [Accessed 04/11/2016]
[35] Ozden S. et al. (2014). Anisotropically functionalized carbon nanotube array based hygroscopic scaffolds, Applied Materials and Interfaces, vol. 6, pp. 10608-10613, dx.doi.org/10.1021/am5022717
[36 ] Bleninger T., Jirka G. H. (2010). Environmental planning, prediction and management of brine discharges from desalination plants, Middle East Desalination Research Center, MEDRC (Series of R&D Reports, MEDRC Project: 07-AS-003)
[37] Valo M. (2012). Desalination of seawater: a cure for water scarcity? One hundred and fifty countries have desalination infrastructures. But the techniques remain expensive and energy-consuming, Le Monde, 18 April.
[38] Bleninger T., Jirka G.H. (2010), op cit.
[39] Global Water Intelligence, DesalData (2016), https://www.globalwaterintel.com/ [Accessed 04/11/2016, site available by subscription]
[40] D. Talbot, Megascale Desalination, MIT Technology Review, 2015
https://www.technologyreview.com/s/534996/megascale-desalination/ [Accessed 04/11/2016]
[41] Al-Karaghouli A., Kazmerski L. (2012). Comparisons of technical and economic performance of the main desalination processes with and without renewable energy coupling, Denver, Colorado: National Renewable Energy Laboratory, p.13-17 (World Renewable Energy Forum 2012) Available at https://ases.conference-services.net/resources/252/2859/pres/SOLAR2012_0591_presentation.pdf [Accessed 02/11/2016]
[42 ] Ghaffour N., Missimer T. M., Amy G. L. (2013). Technical review and evaluation of the economics of water desalination: Current and future challenges for better water supply sustainability, Desalination, vol. 309, January, pp 197-207.
Further reading
Paris: Lavoisier Tec&Doc (second edition).
http://www.desline.com/
http://www.edsoc.com/
http://www.ide-tech.com/
http://idadesal.org/
http://www.medrc.org/
http://www.veoliawatertechnologies.com/fr/dessalement
The Encyclopedia of Energy is published by the Association des Encyclopédies de l’Environnement et de l’Énergie(www.a3e.fr), contractually linked to Grenoble Alpes University and Grenoble INP, and sponsored by the Academy of Sciences.
To cite this article, please mention the author’s name, the title of the article and its URL on the Encyclopedia of Energy website.
The articles in the Encyclopedia of Energy are licensed under the terms of the Creative Commons Attribution-Noncommercial-No Derivative Works 4.0 International License.